Field Notes
<--2021-11-30 09:30:00 | 2022-01-02 09:20:00-->Phenocam link: Searching...
Gilbert Tract: 2021-12-15 10:00:00 (DOY 349)
Author: Daphne Szutu
Others:
Summary: Regular data collection/cleaning, installed new conductivity + water level sensor
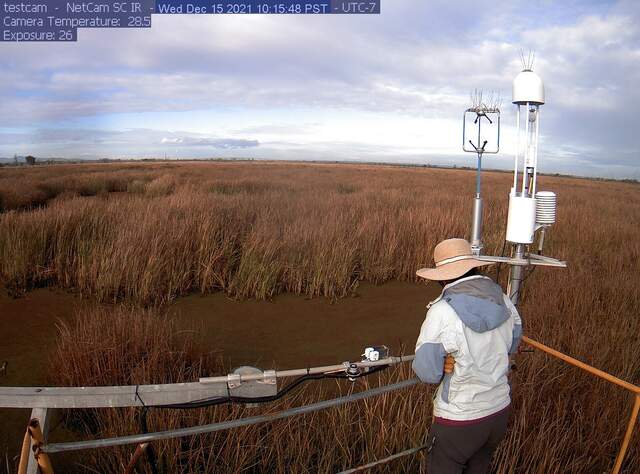
| 2021-12-15 Gilbert Tract I arrived at 10:00 PST. It was cold with a chilly breeze and partly cloudy. The gate latch was a bit stuck and 2 guys from River Partners drove by and helped me open it (after inquiring who I was with). This is the only site visit today because we didn't get to it yesterday before dark. There were some clouds clustered on top of Mt. Diablo and you could see a dusting of snow on the peak. The water level was low and the tide was coming in. I cleaned flux and rad sensors and topped off the wash reservoir, which had been about 1/3 empty. I downloaded met, cam, and USB GHG data. I downloaded the gamecam files. There were 1-2 good videos this time. The feet of the otters are still getting cut off, so I moved the camera about 5cm lower on the wooden stake. I put on the waders and got in the water to install our new METER HYDROS21 probe sn 1782303006 that measures conductivity, temperature, and depth (CTD). I put it in the water as far as the cable would go. For now it is laying on the ground, but we will hang it from the boardwalk next time after installing the boardwalk. This is a SDI-12 sensor that I wired into a control port. I uploaded a new datalogger program and the numbers looked reasonable. I checked the conductivity sensor as part of its routine check and its orifice was clean. LI-7500 readings: CO2 435ppm H2O 400ppm T 7.8C P 102.3kPa SS 100 --> 101 after cleaning LI7700 readings: CH4 2.6ppm RSSI 43 --> 80 after cleaning I left at 10:45 PST and headed back to the lab. |
1 photos found

gilberttract_2021_12_15_101405.jpg ( 2021-12-15 10:15:48 ) Full size: 1296x960
Daphne cleaning sensors
8 sets found
Can't check MBWPEESWGT_mixed
Can't check MBEEWPSWEPGT_cam
16 GT_met graphs found
4 GT_flux graphs found
No data found for GT_adcp.
1 GT_cam graphs found
2 GT_usgs graphs found
2 GT_chanexo graphs found

