
Field Notes
<--2021-11-18 13:30:00 | 2021-12-14 14:25:00-->Other sites visited today: Gilbert Tract
Phenocam link: Searching...
West Pond: 2021-11-30 14:35:00 (DOY 334)
Author: Daphne Szutu
Others: Ari
Summary: Regular data collection/cleaning, calibrated 7700, fresh bird bits on the around the tower
| 2021-11-30 West Pond Ari and I arrived at 14:35 PST. It was a mild and relatively still day with hazy horizons and a few clouds in the sky. No water under the tower and the wetland is mostly brown. There were pieces of dead bird on the upper boardwalk, the boom, and on top of the canopy. Looked pretty fresh because the entrails were still soft and glistening. We calibrated the LI-7700 sn TG1-0421. The regulator on the zero air tank was reading <100psi, but there was enough zero air for the calibration. After applying the zero, I watched the concentration fluctuate around 0 for about 30 seconds, so I feel comfortable that the zero point was good. The following day after doing more calibrations, we realized probably the regulator was funky and the tank had more air than the regulator showed. After the calibration, we put the 7700 spiky hat back on and reattached the spray nozzle. The optics RH here was 18%, so we did not swap out the drierite. I downloaded met, camera, USB GHG, and miniDOT data. I swapped the desiccant for the miniDOT and water level sensor. Ari cleaned flux and rad sensors. The reservoir was 3/4 full; I topped it off. LI-7500 readings: CO2 441ppm H2O 602ppm T 19.9C P 101.9kPa SS 99--> 101 after cleaning LI7700 readings: CH4 2.4 ppm RSSI 68--> 81 after cleaning We left around 15:30 PST. |
1 photos found
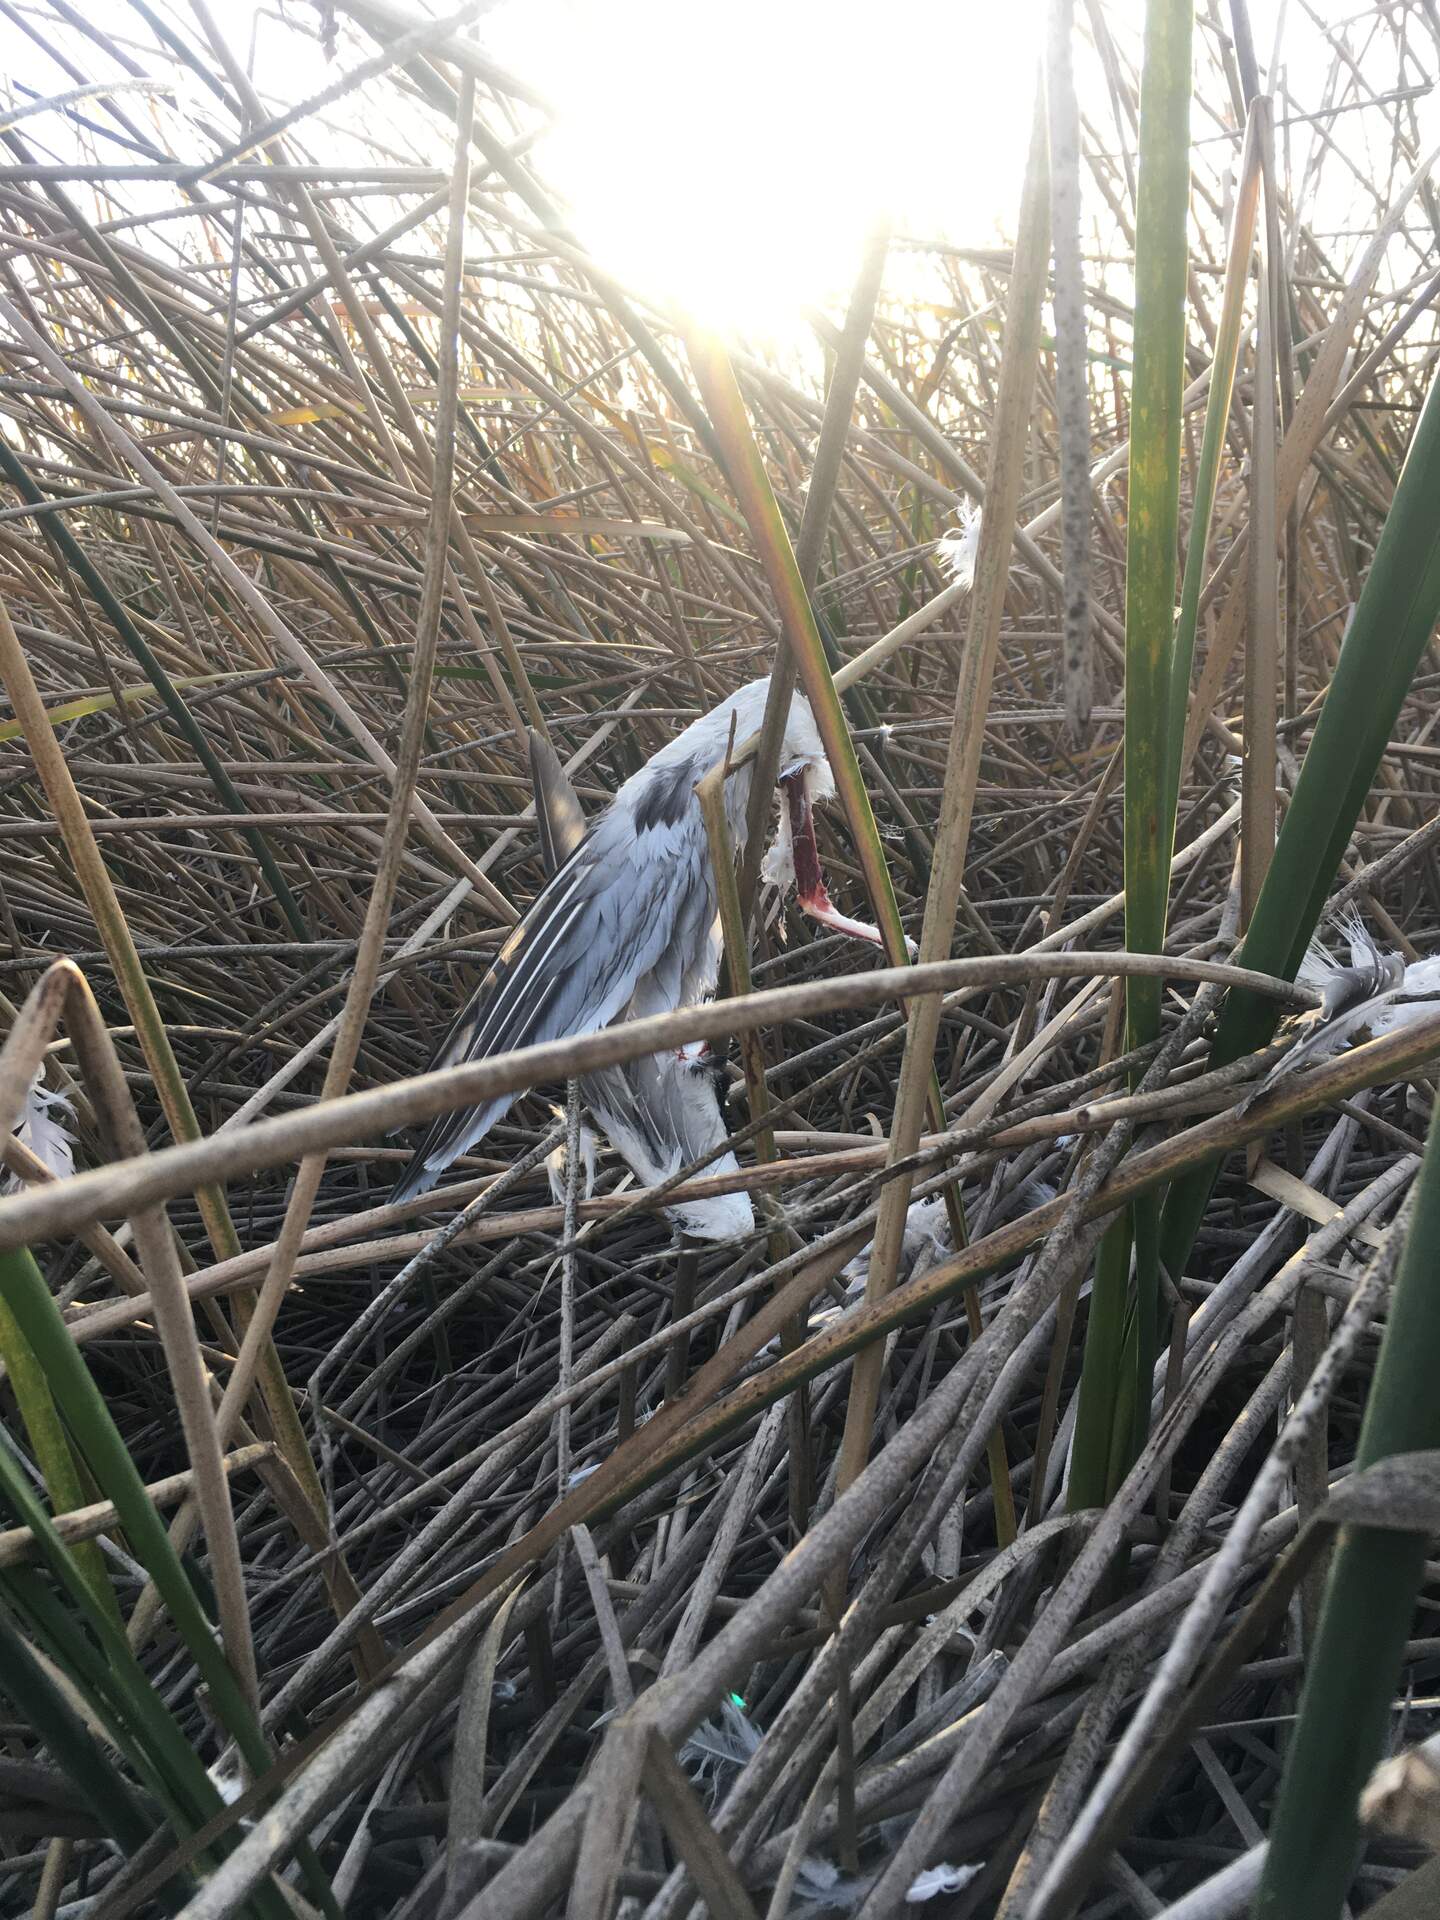
20211130WP_BirdWing.jpg ( 2021-11-30 15:25:38 ) Full size: 1440x1920
Fresh bird wing in the reeds by the tower, probably dropped from the rad boom.
8 sets found
Can't check WP_DO
1 WP_DO graphs found
14 WP_met graphs found
5 WP_flux graphs found
Can't check MBWPEESWGT_mixed
Can't check MBEEWPSWEPGT_cam
Can't check MBSWEEWPBCBA
1 WP_processed graphs found
4 WP_arable graphs found