Field Notes

<--2021-12-01 16:45:00 | 2021-12-14 09:55:00-->
Other sites visited today: Vaira | Tonzi

Hill Slough: 2021-12-02 14:30:00 (DOY 336)
Author: Joe Verfaillie
Others:

Summary: High tide, replaced MiniDot.

Hill Slough
2021-12-02

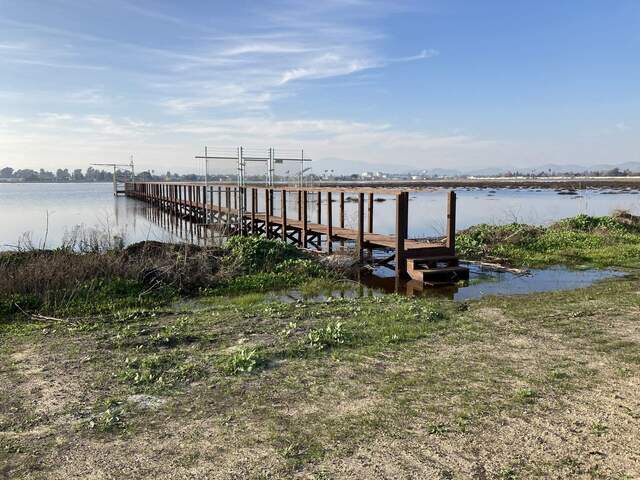
I arrived at about 14:30 PST. Tide was high with a puddle in front of the stairs to the boardwalk and the water was only about 30cm below the boardwalk. The staff gauge read 6.38ft.

This was just a quick stop to put back the minidot sn 931528 which we removed from the field yesterday to replace its dead batteries.

5 photos found

At high tide the water is only about 30cm below the boardwalk
20211202HS_HighTide.jpg ( 2021-12-02 14:31:18 ) Full size: 1920x1440
At high tide the water is only about 30cm below the boardwalk

Sunset just as we arrived on site
20211201HS_Sunset.jpg ( 2021-12-01 16:41:21 ) Full size: 1920x1440
Sunset just as we arrived on site

Venus reflected in the calm water at dusk
20211201HS_Venus.jpg ( 2021-12-01 17:26:25 ) Full size: 1440x1920
Venus reflected in the calm water at dusk
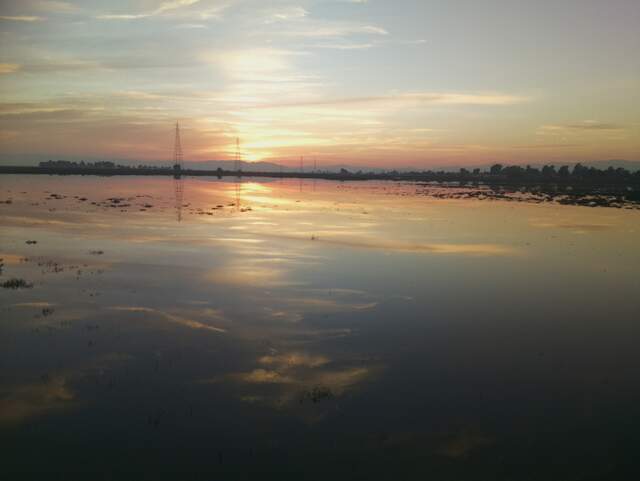
Nice sunset reflected in water
HS_picam_20211202_1645.jpg ( 2021-12-02 16:45:06 ) Full size: 1917x1440
Nice sunset reflected in water
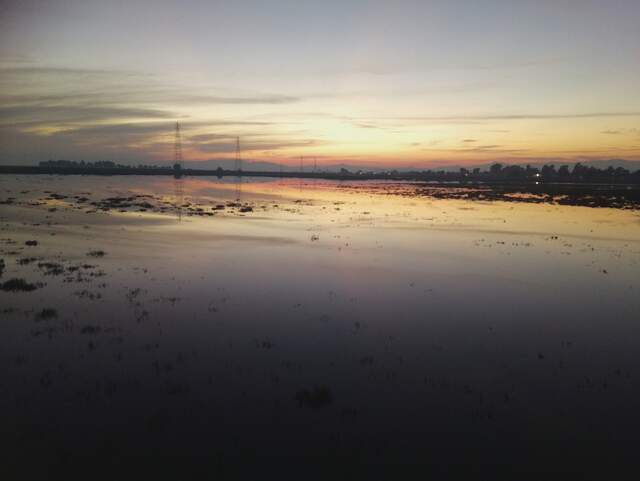
Nice sunset
HS_picam_20211202_1715.jpg ( 2021-12-02 17:15:05 ) Full size: 1917x1440
Nice sunset

Graphs display:
4 sets found

20 HS_met graphs found

Explore the graph:Temperatures in a new window

Explore the graph:Temperature Profile A in a new window

Explore the graph:Temperature Profile B in a new window

Explore the graph:Temperature Profile C in a new window

Explore the graph:Soil Heat Flux in a new window

Explore the graph:Four-channel radiometer in a new window

Explore the graph:NDVI Channels in a new window

Explore the graph:PAR in a new window

Explore the graph:Air Pressure in a new window

Explore the graph:Air T and RH in a new window

Explore the graph:pCO2 in a new window

Explore the graph:Soil Moisture in a new window

Explore the graph:Battery Voltage in a new window

Explore the graph:Forced Diffusion Soil CO2 Flux in a new window

Explore the graph:Dissolved Oxygen in a new window

Explore the graph:Water Level in a new window

Explore the graph:Conductivity in a new window

Explore the graph:EXO pH + ORP in a new window

Explore the graph:EXO Turbidity + fDOM in a new window

Explore the graph:Water Temp in a new window

4 HS_flux graphs found

Explore the graph:CO2 and H2O in a new window

Explore the graph:Wind in a new window

Explore the graph:Methane in a new window

Explore the graph:Data Counts in a new window

1 HS_cam graphs found

Explore the graph:GCC in a new window

Can't check HS_Processed
2 HS_Processed graphs found

Explore the graph:Energy in a new window

Explore the graph:CO2, CH4 Net Fluxes in a new window