Field Notes
<--2021-10-26 12:00:00 | 2021-12-02 10:15:00-->Other sites visited today: Vaira
Phenocam link: Searching...
Tonzi: 2021-11-17 12:20:00 (DOY 321)
Author: Joe Verfaillie
Others:
Summary: Green grass, wet, standard field work, all seems well
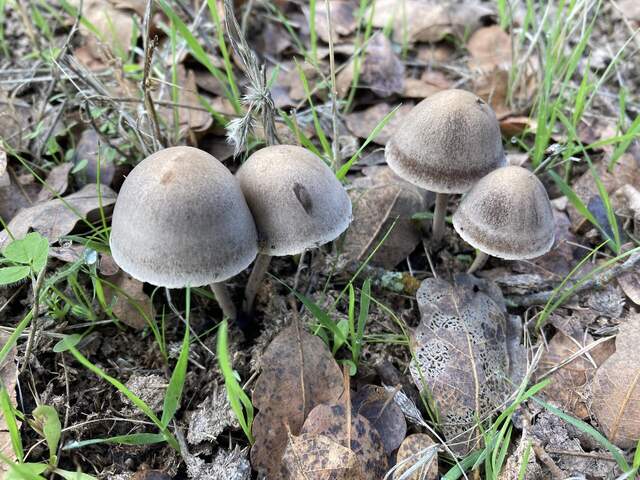
| Tonzi 2021-11-17 I arrived at about 12:20 PST. It was cool and overcast with the sun peeking through a couple of times. The trees still have some green leaves – not unusual for this time of year and about half are turning yellow/brown. The ground is wet and the grass it about 2-5cm tall. The pond level hasn’t changed much – still a little more than about half full. Mushrooms coming up here and there. There is dense, lush growth of weeds around most of the ant mounds. I collected met, flux, camera images, DHB, soil moisture, well levels and the FD data. All seemed well. The Tower 7500: 455.6ppm CO2, 502.5mmol/m3 H2O, 99.9kPa, 13.7C, 103.6SS The Floor 7500: 457.2ppm CO2, 523.3mmol/m3 H2O, 99.4kPa, 14.5C, 101.3SS I got all prepared to swap the fan on the Floor HMP but discovered that the fan had started running again. I wiggled the wire a little and it kept going. Don’t fix what aint broke. I turned the electric fence on around the tower. It powered right up and seemed to be working well. I didn’t try the charger on the soil co2 fence. I left at about 14:40 PST |
Field Data
No tank data
Well Depth
| Date | Location | Depth (feet) |
|---|---|---|
| 2021-11-17 | VR_well | 58.25 |
| 2021-11-17 | VR_pond | 19.98 |
| 2021-11-17 | TZ_floor | 32.2 |
| 2021-11-17 | TZ_road | 39.9 |
mode = both
Moisture Point Probes TZ
Array
(
[0] => Tower_1
[1] => Soil_Transect_3_1
[2] => Soil_Transect_2_1
[3] => Soil_Transect_1_1
[4] => SoilCO2_West_A_1
[5] => SoilCO2_West_B_1
[6] => SoilCO2_West_C_1
[7] => Tower_2
[8] => Soil_Transect_4_2
[9] => Soil_Transect_3_2
[10] => Soil_Transect_2_2
[11] => Soil_Transect_1_2
[12] => SoilCO2_West_A_2
[13] => SoilCO2_West_B_2
[14] => SoilCO2_West_C_2
[15] => Tower_3
[16] => Soil_Transect_4_3
[17] => Soil_Transect_3_3
[18] => Soil_Transect_2_3
[19] => Soil_Transect_1_3
[20] => SoilCO2_West_A_3
[21] => SoilCO2_West_B_3
[22] => SoilCO2_West_C_3
[23] => Tower_4
[24] => Soil_Transect_4_4
[25] => Soil_Transect_3_4
[26] => Soil_Transect_2_4
[27] => Soil_Transect_1_4
[28] => SoilCO2_West_A_4
[29] => SoilCO2_West_B_4
[30] => SoilCO2_West_C_4
[31] => Soil_Transect_4_1
)
| Date | DOY | Rep | Depth | Tower_1 |
Soil_Transect_3_1 |
Soil_Transect_2_1 |
Soil_Transect_1_1 |
SoilCO2_West_A_1 |
SoilCO2_West_B_1 |
SoilCO2_West_C_1 |
Tower_2 |
Soil_Transect_4_2 |
Soil_Transect_3_2 |
Soil_Transect_2_2 |
Soil_Transect_1_2 |
SoilCO2_West_A_2 |
SoilCO2_West_B_2 |
SoilCO2_West_C_2 |
Tower_3 |
Soil_Transect_4_3 |
Soil_Transect_3_3 |
Soil_Transect_2_3 |
Soil_Transect_1_3 |
SoilCO2_West_A_3 |
SoilCO2_West_B_3 |
SoilCO2_West_C_3 |
Tower_4 |
Soil_Transect_4_4 |
Soil_Transect_3_4 |
Soil_Transect_2_4 |
Soil_Transect_1_4 |
SoilCO2_West_A_4 |
SoilCO2_West_B_4 |
SoilCO2_West_C_4 |
Soil_Transect_4_1 |
Avg | Spacial Count |
Measurement Count |
|---|---|---|---|---|---|---|---|---|---|---|---|---|---|---|---|---|---|---|---|---|---|---|---|---|---|---|---|---|---|---|---|---|---|---|---|---|---|---|
| 2021-11-17 | 321 | 0 | nan | 35.5 | 21.7 | 24.7 | 19.7 | 32.9 | 29.7 | 25.3 | 33.8 | 26.5 | 32.9 | 31 | 18.2 | 26.1 | 21 | 30.7 | 32.7 | 28.5 | 33.5 | 34.1 | 31.8 | 35.7 | 37.1 | 38.5 | 43.1 | 33.7 | 45.4 | 48.8 | 32.8 | 45.4 | 49.7 | 50.3 | ||||
| 2021-11-17 | 321 | 1 | nan | 32.9 | 22.3 | 24.1 | 20 | 33.2 | 29.4 | 25.8 | 33.8 | 26.1 | 32.9 | 30.7 | 18.8 | 25.5 | 21.6 | 30.1 | 33.8 | 28.8 | 33.5 | 34.6 | 31.8 | 35.7 | 36.8 | 37.4 | 41.7 | 35.1 | 45.1 | 49.1 | 33.4 | 45.7 | 51.7 | 49.1 | 24.1 | |||
| 2021-11-17 | 321 | Avg | 0-15cm | 0 | 0 | |||||||||||||||||||||||||||||||||
| 2021-11-17 | 321 | Avg | 15-30cm | 0 | 0 | |||||||||||||||||||||||||||||||||
| 2021-11-17 | 321 | Avg | 30-45cm | 0 | 0 | |||||||||||||||||||||||||||||||||
| 2021-11-17 | 321 | Avg | 45-60cm | 0 | 0 |
No VR Moisture Point data found
No TZ grass heigth found
No VR grass heigth found
Tree DBH
| Date | Tag# | Reading (mm) |
|---|---|---|
| 2021-11-17 | 1 | 16.4 |
| 2021-11-17 | 102 | 14.2 |
| 2021-11-17 | 2 | 14.3 |
| 2021-11-17 | 245 | 4.1 |
| 2021-11-17 | 3 | 19.4 |
| 2021-11-17 | 4 | 14.9 |
| 2021-11-17 | 5 | 8.4 |
| 2021-11-17 | 6 | 19.7 |
| 2021-11-17 | 7 | 8.1 |
| 2021-11-17 | 72 | 12.9 |
| 2021-11-17 | 79 | 12.4 |
No water potential data found
No TZ Grass Biomass data found
No TZ OakLeaves Biomass data found
No TZ PineNeedles Biomass data found
2 photos found

20211117TZ_Mushrooms.jpg ( 2021-11-17 13:41:08 ) Full size: 1920x1440
Several different types of mushrooms are coming up

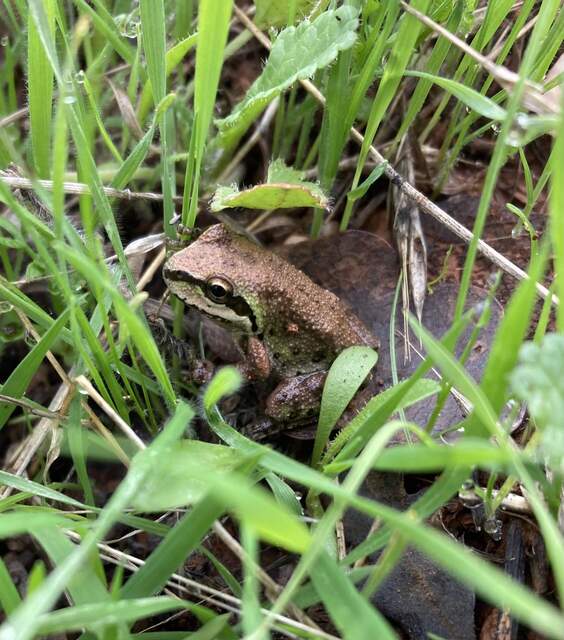
20211117TZ_Frog.jpg ( 2021-11-17 13:13:41 ) Full size: 1693x1920
Tree frog in the wet grass
16 sets found
No data found for TZ_Fenergy.
11 TZ_tmet graphs found
11 TZ_soilco2 graphs found
Can't check TZ_mixed
3 TZ_mixed graphs found
1 TZ_fflux graphs found
8 TZ_fmet graphs found
No data found for TZ_tram.
3 TZ_co2prof graphs found
1 TZ_irt graphs found
No data found for TZ_windprof.
1 TZ_tflux graphs found
2 TZ_sm graphs found
Can't check TZ_met
1 TZ_met graphs found
Can't check TZVR_mixed
8 TZ_osu graphs found
3 TZ_fd graphs found
Tonzi Z-cam data

