
Field Notes
<--2021-07-06 10:50:00 | 2021-07-28 11:00:00-->Other sites visited today: Mayberry | West Pond | East End
Phenocam link: Searching...
Sherman Wetland: 2021-07-21 08:20:00 (DOY 202)
Author: Daphne Szutu
Others: Robert
Summary: Regular data collection/cleaning, caterpillars!, trimmed tules and scraped away poop
| 2021-07-21 Sherman Wetland Robert and I arrived at 8:20 PDT. It was a mild, hazy day. Sherman Wetland has the beginnings of a caterpillar infestation; maybe 10% of the cattails around the tower and boardwalk looked chewed. The tules looked fine. It’s the same insect we’ve seen at Mayberry in the past: a fuzzy black caterpillar with yellow stripes and red dots along the stripe. The staff gauge read 88cm. I scrubbed at the staff gauge but it would probably be more effective with a long-handled brush. I downloaded met, cam, and USB GHG data. We topped off the wash reservoir. Robert cleaned the flux and rad sensors. The wash reservoir had a mud dauber nest inside which we broke up with a pair of pliers. I was surprised to find the cells of the nest filled with dead spiders. Further internet research explained that this is how a mud dauber usually provisions its nest. The female wasp is a solitary (non-social) insect that lays an egg in each cell, fills it with paralyzed spiders, and then seals the cells before abandoning the nest. Once the wasp larvae hatches, it will eat the spiders and pupate before chewing out of its cell and flying away. Robert trimmed the tules that were growing into the boardwalk and I used the shovel to scrape away the otter/raccoon poop. I also cleared the poop cache in the white lattice by the tower. LI-7500 readings: CO2 399ppm H2O 650ppm T 21.8C P 101.3kPa SS 99--> 100 after cleaning LI7700 readings: CH4 2.1ppm RSSI 35--> 79 after cleaning We left at 9:00 PDT. |
3 photos found

20210721SW_BabyCaterpillar.jpg ( 2021-07-21 08:53:29 ) Full size: 1440x1920
Small caterpillar munching on cattail
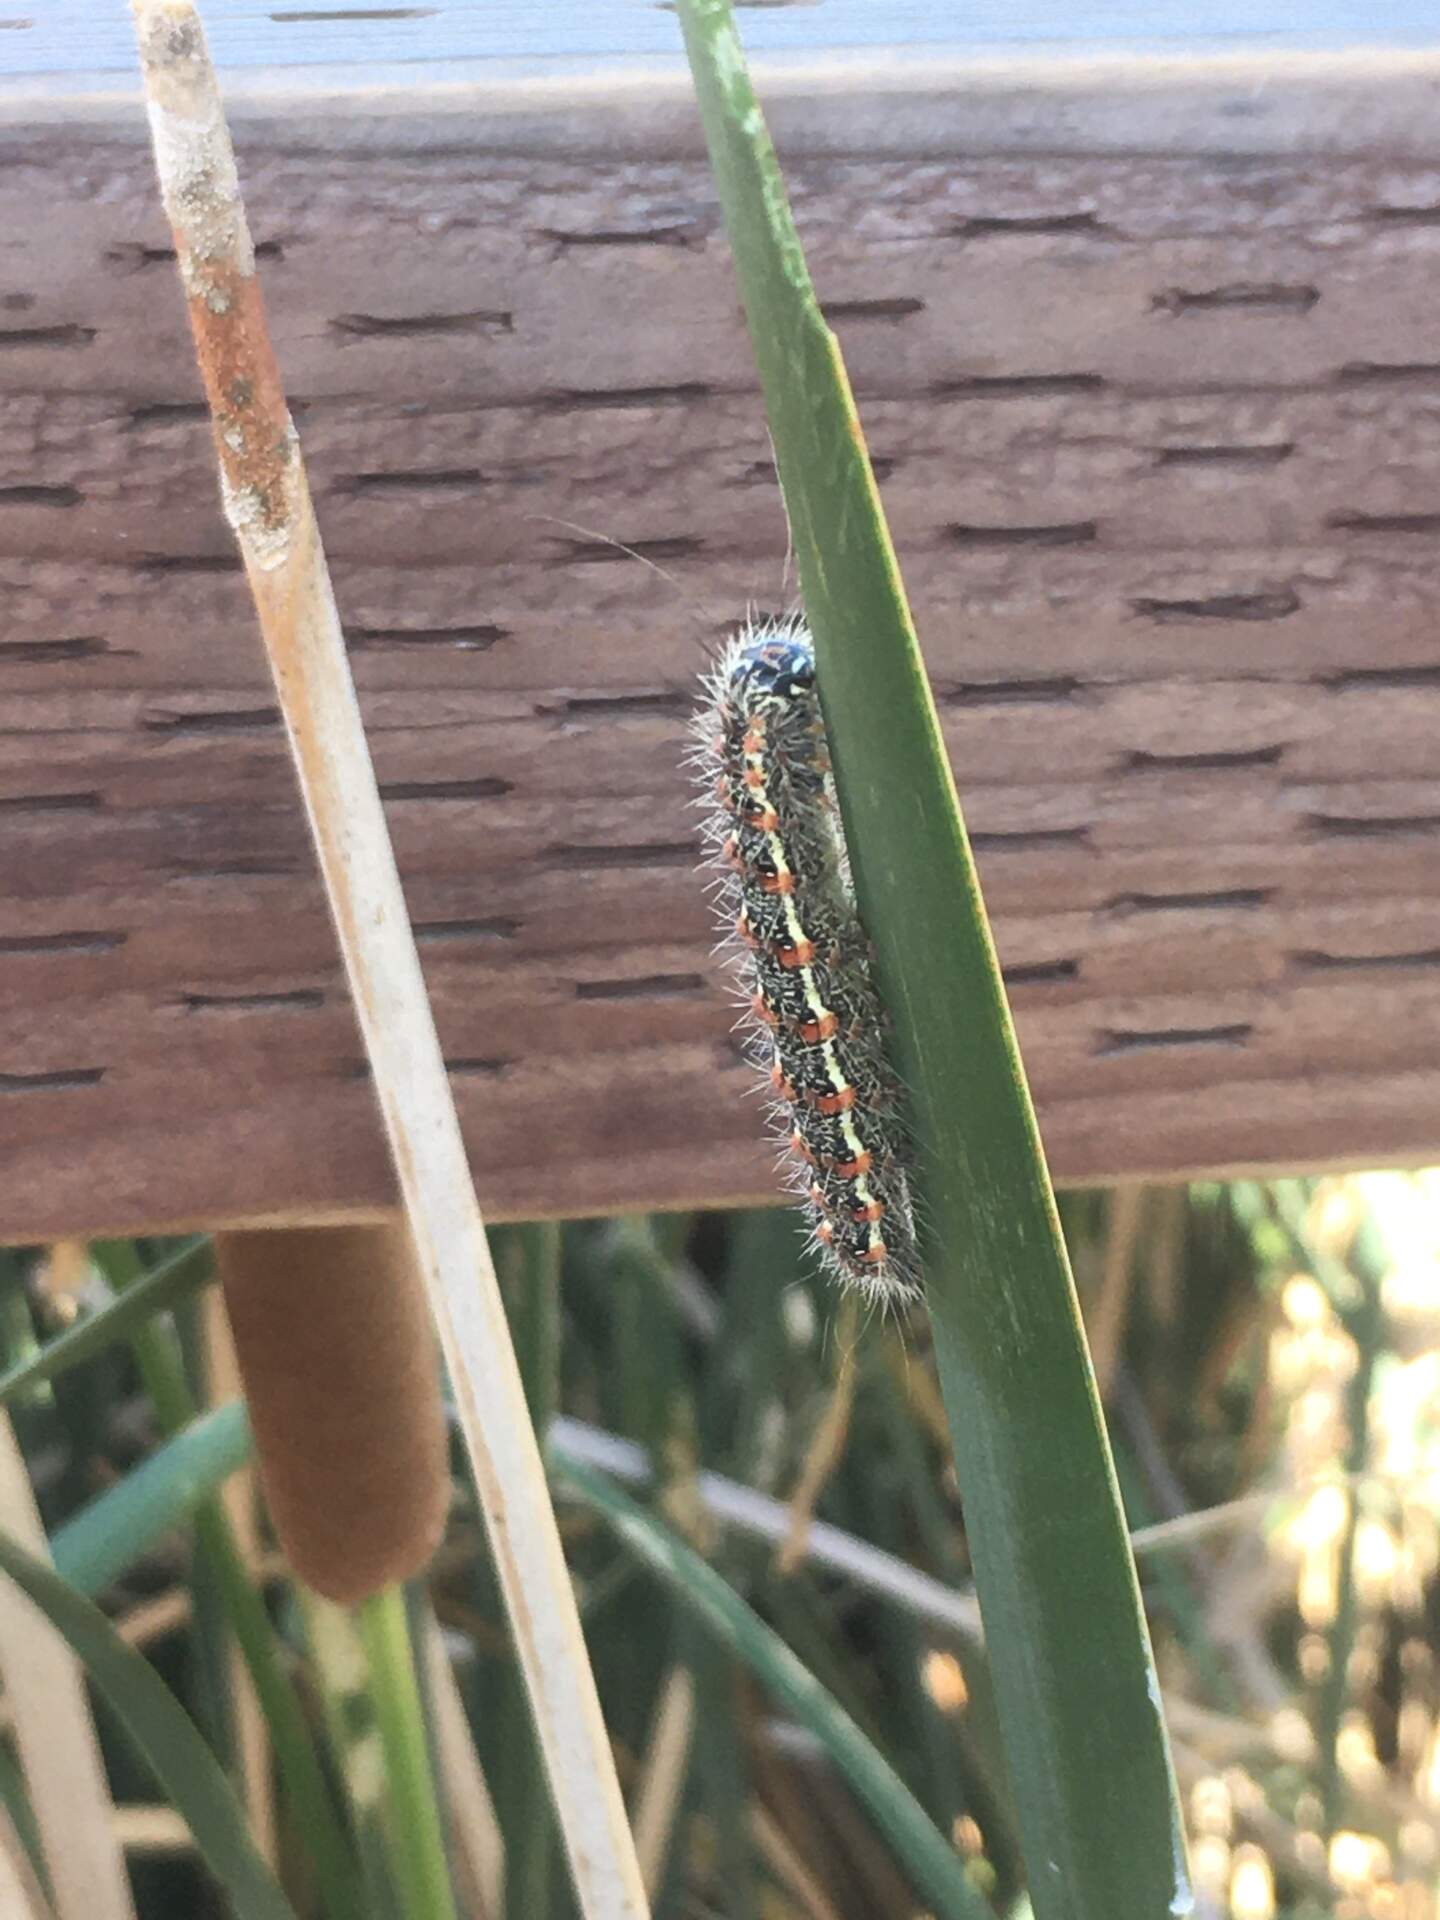
20210721SW_Caterpillar.jpg ( 2021-07-21 08:52:42 ) Full size: 1440x1920
Caterpillar eating cattail at SW tower

siwetland_2021_07_22_094405.jpg ( 2021-07-22 09:45:42 ) Full size: 1296x960
Mystery people on a motorboat
7 sets found
Can't check MBWPEESWGT_mixed
Can't check MBEEWPSWEPGT_cam
16 SW_met graphs found
4 SW_flux graphs found
Can't check MBSWEEWPBCBA
Can't check SW_Temp
14 SW_Temp graphs found
3 SW_arable graphs found