Field Notes

<--2021-07-06 14:20:00 | 2021-08-04 14:50:00-->
Other sites visited today: Sherman Wetland | Mayberry | West Pond

East End: 2021-07-21 12:05:00 (DOY 202)
Author: Daphne Szutu
Others: Robert

Summary: Regular data collection/cleaning, water level going down, installed radiometer intercomparison

2021-07-21
East End

Robert and I arrived at 12:05 PDT. It was a warm, hazy day. The reeds are looking tall and green, and the tules in front of the solar panel need to be trimmed before the winter (probably at WP as well). The water level is still going down and the staff gauge read 11cm.

I downloaded met, cam, and USB GHG data. We topped off the wash reservoir. Robert cleaned the flux and rad sensors.

We installed the intercomparison radiometers on the rad boom and leveled them. I connected to the comparison datalogger and confirmed the numbers looked reasonable.

Datalogger and sensors added:
CR1000 sn 23865
CNR4 sn 121038
PAR sn 060831
NDVI in sn 1049
NDVI out sn 1050

LI-7500 readings:
CO2 400ppm
H2O 760ppm
T 27.4C
P 101.1kPa
SS 98 --> forgot to write after cleaning
LI7700 readings:
CH4 2.0
RSSI 35 --> 80 after cleaning

We left at 13:05 PDT.

1 photos found

Reference radiometers (4-way, PAR, NDVI pair) set up on EE rad boom for an intercomparison
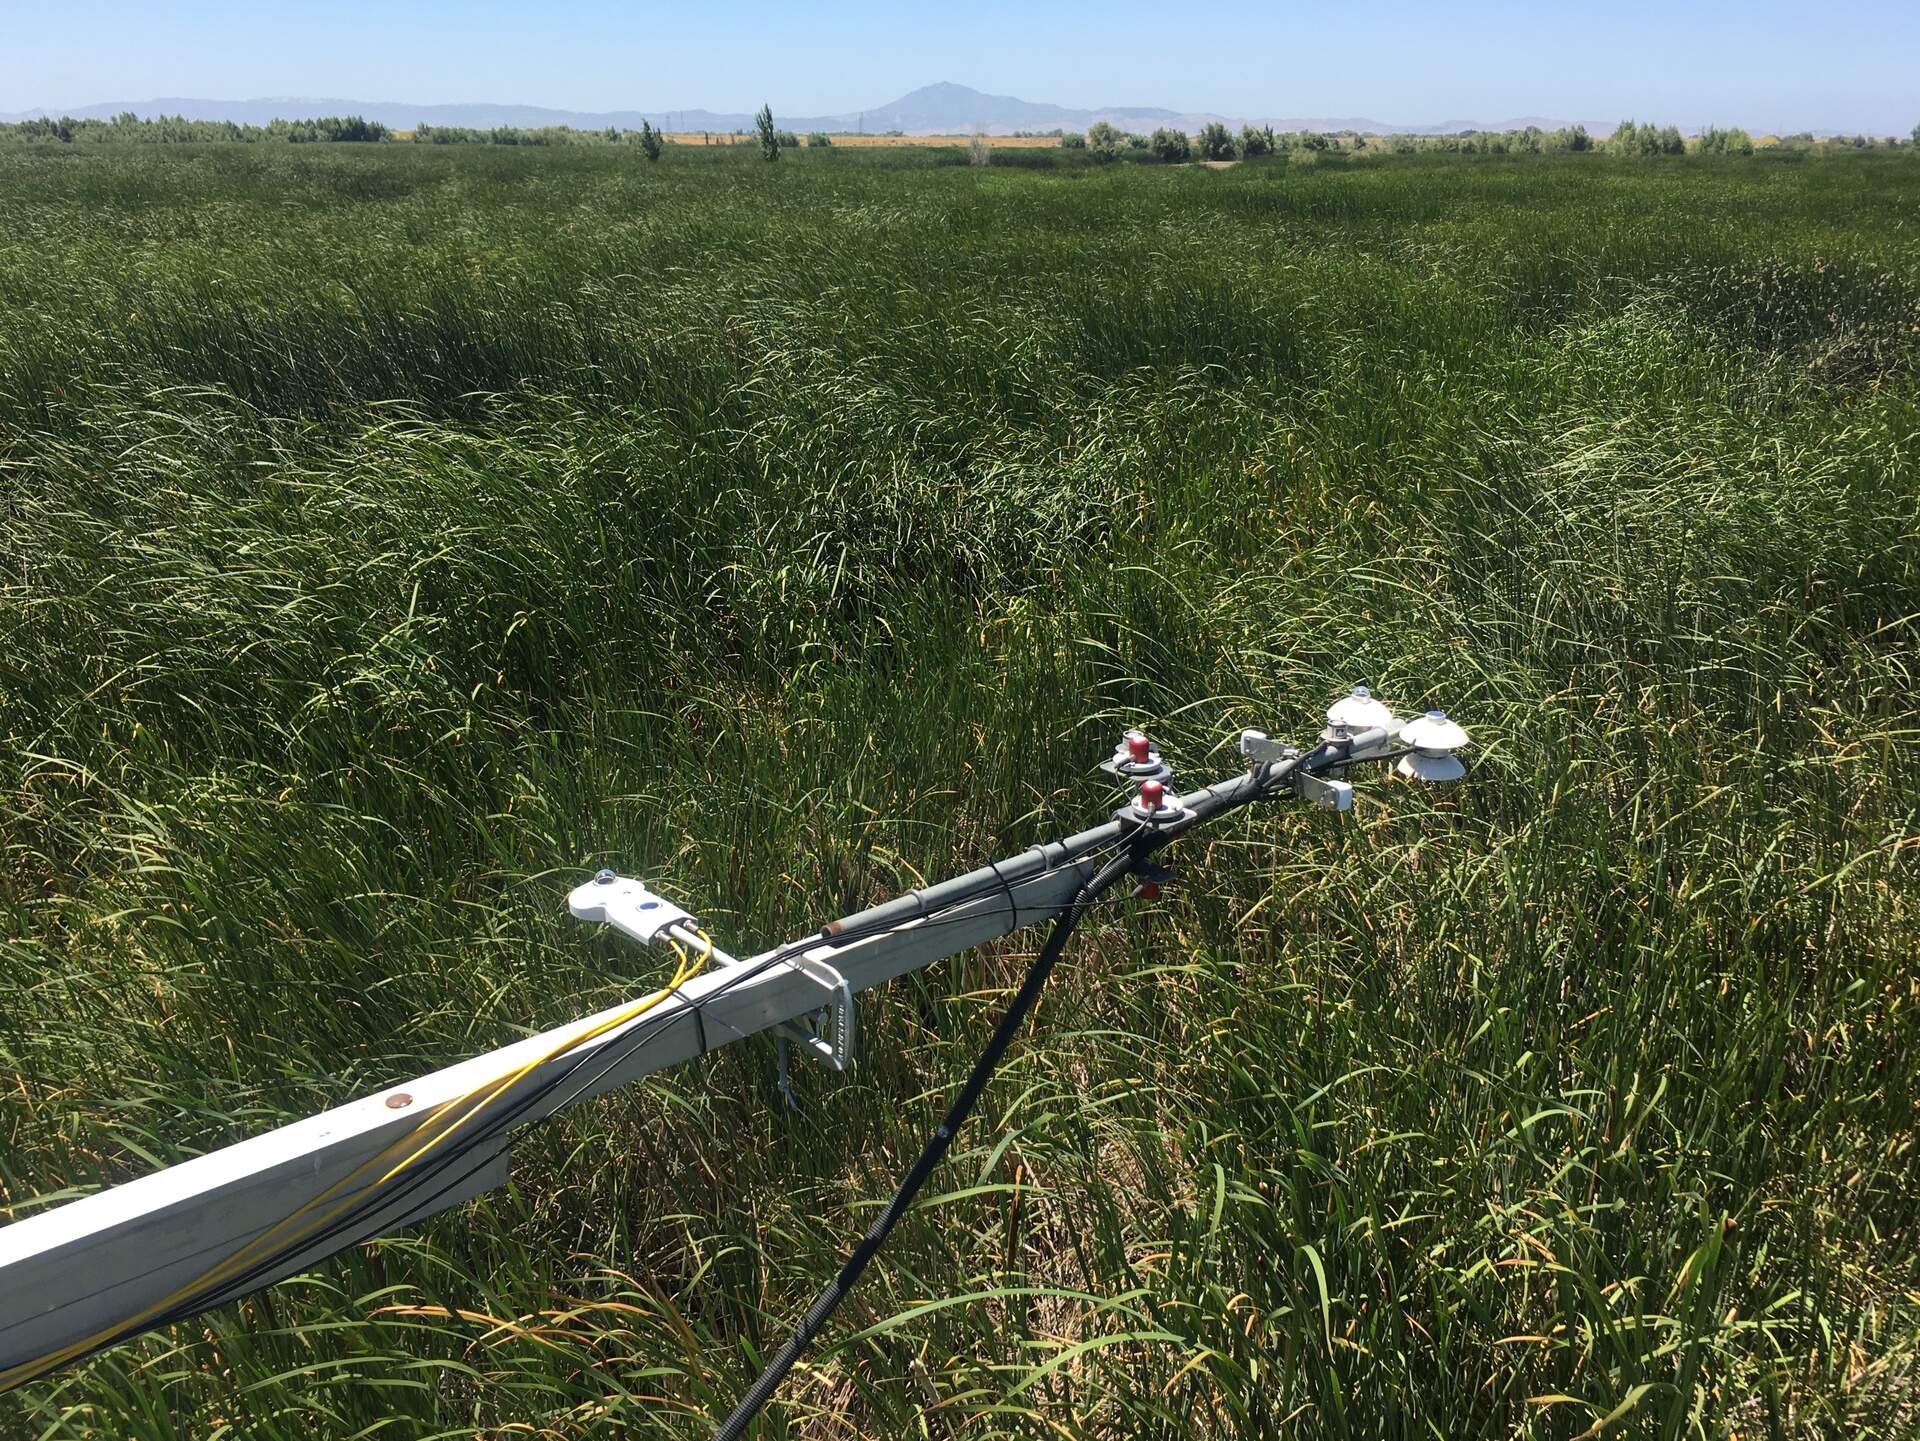
20210721EE_RadIntercomparison.jpg ( 2021-07-21 12:54:22 ) Full size: 1920x1441
Reference radiometers (4-way, PAR, NDVI pair) set up on EE rad boom for an intercomparison

Graphs display:
11 sets found

14 EE_met graphs found

Explore the graph:Temperature and Batt V in a new window

Explore the graph:Soil Moisture and Well Pressure in a new window

Explore the graph:Solar Radiation in a new window

Explore the graph:PAR in a new window

Explore the graph:Soil Heat Flux in a new window

Explore the graph:Water Level and Rain in a new window

Explore the graph:Soil/Water Temperature Set 1 in a new window

Explore the graph:Soil/Water Temperature Set 2 in a new window

Explore the graph:Soil/Water Temperature Set 3 in a new window

Explore the graph:Dissolved Oxygen and Wind Speed in a new window

Explore the graph:SRS NDVI Channels in a new window

Explore the graph:Apogee NDVI in a new window

Explore the graph:NDVI in a new window

Explore the graph:Undercanopy PAR in a new window

Can't check EE_mixed
1 EE_mixed graphs found

Explore the graph:Air Pressure and RH in a new window

8 EE_flux graphs found

Explore the graph:Wind Speeds in a new window

Explore the graph:LI7500 CO2 and H2O in a new window

Explore the graph:LI7700 CH4 and RSSI in a new window

Explore the graph:Flux Counts in a new window

Explore the graph:Instument Temperatures in a new window

Explore the graph:Temp Tower 3 (Mixed Veg) in a new window

Explore the graph:Temp Tower 3 (Mixed Veg) in a new window

Explore the graph:Temp Tower 3 (Mixed Veg) in a new window

Can't check MBWPEESWGT_mixed
1 EE_cam graphs found

Explore the graph:EE Autocam GCC in a new window

Can't check MBEEWPSWEPGT_cam
Can't check SIMBTWEE_met
Can't check EE_Temp
5 EE_Temp graphs found

Explore the graph:Sonic SOS in a new window

Explore the graph:LI7500 CO2 in a new window

Explore the graph:Water Level in a new window

Explore the graph:LI-7700 CH4 in a new window

Explore the graph:Wind Speed in a new window

Can't check EE_minidot
1 EE_minidot graphs found

Explore the graph:EE miniDOT Dissolved Oxygen in a new window

Can't check MBSWEEWPBCBA
1 EE_processed graphs found

Explore the graph:CO2 Fluxes in a new window