
Field Notes
<--2021-06-02 13:00:00 | 2021-07-13 11:50:00-->Other sites visited today: Bouldin Corn | Vaira
Phenocam link: Searching...
Tonzi: 2021-06-24 14:40:00 (DOY 175)
Author: Joe Verfaillie
Others:
Summary: Reinstalled cal panel IRT, added sun shield to open FD chamber, added water to Floor and soil co2 battery banks, swapped road well power pack.
| Tonzi 2021-06-24 I arrive at about 14:40 PDT. It was clear sunny and hot with a variable breeze. There were some thunderheads to the northeast. The pond is nearly dry. From the top of the tower several oak tress seem to have some yellow leave on their tops. Some of the pines also seem to have clumps of brown needles. I’m not sure this is exceptional; maybe I’m hyper sensitive due the dry conditions this year. I collected the eddy, met, soil moisture, well depth, dbh and zcam data. This was the first collection of the eddy data since upgrading the firmware – no issues found. The Tower 7500 read: 410.5ppm CO2, 511.5mmol/m3 H2O, 98.9kPa, 28.8C, 99.3SS The Floor 7500 read: 415.8ppm CO2, 455.6mmol/m3 H2O, 99.0kPa, 32.2C, 101.2SS I wonder if the difference in the water vapor is the trees. Both scales fell off the dendrometer on tree 245 - I found the larger one. A couple of the other dendrometers had higher readings than expected. I'm wondering if woodpeckers are vandalizing them - pounding the ribbons into cracks. I added a sun shield to the open FD chamber. The sun shield is a split piece of pipe the fits around the body of the chamber and a mirrored Mylar hat that bolts to the guywire ring. The other FD chamber is under the trees and doesn’t get as hot but I’ll look at the data to see if it needs a sun shield too. I downloaded and cleared the FD data. I finally got the wiring right on the Apogee IRT sn 1624 on the cal panel – reinstalled and working. I swapped the lithium power pack on the Global Water sensor. The last one died soon after my last visit. I might put a small solar panel on this one like the Vaira pond. I checked the water level in the batteries on the Floor battery bank sn BB-TF and the soil co2 battery bank sn BB-TZ_soilco2. I didn’t see any plates exposed but added about 1.5 gallons to each bank of four batteries. I’ll need to bring more water for the Tower batteries next time. We should probably check the Delta batteries too. I left at about 17:30 |
Field Data
No tank data
Well Depth
| Date | Location | Depth (feet) |
|---|---|---|
| 2021-06-24 | VR_well | 57.95 |
| 2021-06-24 | VR_pond | 14.92 |
| 2021-06-24 | TZ_floor | 31.95 |
| 2021-06-24 | TZ_road | 38.9 |
| 2021-06-24 | TZ_tower | 35.5 |
mode = both
Moisture Point Probes TZ
Array
(
[0] => Tower_1
[1] => Floor_South_1
[2] => Soil_Transect_4_1
[3] => Soil_Transect_3_1
[4] => Soil_Transect_2_1
[5] => Soil_Transect_1_1
[6] => SoilCO2_West_A_1
[7] => SoilCO2_West_B_1
[8] => SoilCO2_West_C_1
[9] => Tower_2
[10] => Floor_South_2
[11] => Soil_Transect_4_2
[12] => Soil_Transect_3_2
[13] => Soil_Transect_2_2
[14] => Soil_Transect_1_2
[15] => SoilCO2_West_A_2
[16] => SoilCO2_West_B_2
[17] => SoilCO2_West_C_2
[18] => Tower_3
[19] => Soil_Transect_4_3
[20] => Soil_Transect_3_3
[21] => Soil_Transect_2_3
[22] => Soil_Transect_1_3
[23] => SoilCO2_West_A_3
[24] => SoilCO2_West_B_3
[25] => SoilCO2_West_C_3
[26] => Tower_4
[27] => Soil_Transect_4_4
[28] => Soil_Transect_3_4
[29] => Soil_Transect_2_4
[30] => Soil_Transect_1_4
[31] => SoilCO2_West_A_4
[32] => SoilCO2_West_B_4
[33] => SoilCO2_West_C_4
)
| Date | DOY | Rep | Depth | Tower_1 |
Floor_South_1 |
Soil_Transect_4_1 |
Soil_Transect_3_1 |
Soil_Transect_2_1 |
Soil_Transect_1_1 |
SoilCO2_West_A_1 |
SoilCO2_West_B_1 |
SoilCO2_West_C_1 |
Tower_2 |
Floor_South_2 |
Soil_Transect_4_2 |
Soil_Transect_3_2 |
Soil_Transect_2_2 |
Soil_Transect_1_2 |
SoilCO2_West_A_2 |
SoilCO2_West_B_2 |
SoilCO2_West_C_2 |
Tower_3 |
Soil_Transect_4_3 |
Soil_Transect_3_3 |
Soil_Transect_2_3 |
Soil_Transect_1_3 |
SoilCO2_West_A_3 |
SoilCO2_West_B_3 |
SoilCO2_West_C_3 |
Tower_4 |
Soil_Transect_4_4 |
Soil_Transect_3_4 |
Soil_Transect_2_4 |
Soil_Transect_1_4 |
SoilCO2_West_A_4 |
SoilCO2_West_B_4 |
SoilCO2_West_C_4 |
Avg | Spacial Count |
Measurement Count |
|---|---|---|---|---|---|---|---|---|---|---|---|---|---|---|---|---|---|---|---|---|---|---|---|---|---|---|---|---|---|---|---|---|---|---|---|---|---|---|---|---|
| 2021-06-24 | 175 | 0 | nan | 4.5 | 3.1 | 2.5 | 1.5 | 3 | 4.2 | 7.1 | 3.1 | 1.2 | 12.1 | 4.8 | 7.8 | 13.9 | 12.4 | 4.5 | 6.6 | 1.4 | 11.8 | 14.3 | 10.1 | 12.6 | 16.5 | 13.4 | 15.9 | 17.3 | 11.7 | 18.5 | 12.5 | 19.3 | 29.4 | 13.3 | 19.9 | 10.2 | 14.8 | |||
| 2021-06-24 | 175 | 1 | nan | 4.7 | 0.1 | 2.1 | 1.8 | 2.7 | 4.2 | 7.4 | 1.8 | 11.5 | 7.5 | 13 | 11.8 | 4.2 | 7.5 | 11.8 | 14.5 | 10.3 | 13.1 | 16.5 | 13.4 | 16.8 | 12 | 19.6 | 12.2 | 19.1 | 28.8 | 13.3 | 19.3 | 14.5 | ||||||||
| 2021-06-24 | 175 | Avg | 0-15cm | 0 | 0 | |||||||||||||||||||||||||||||||||||
| 2021-06-24 | 175 | Avg | 15-30cm | 0 | 0 | |||||||||||||||||||||||||||||||||||
| 2021-06-24 | 175 | Avg | 30-45cm | 0 | 0 | |||||||||||||||||||||||||||||||||||
| 2021-06-24 | 175 | Avg | 45-60cm | 0 | 0 |
mode = both
Moisture Point Probes VR
Array
(
[0] => Flux_Tower_1
[1] => Biomass_Cage_1
[2] => Flux_Tower_2
[3] => Biomass_Cage_2
[4] => Flux_Tower_3
[5] => Biomass_Cage_3
[6] => Flux_Tower_4
[7] => Biomass_Cage_4
)
| Date | DOY | Rep | Depth | Flux_Tower_1 |
Biomass_Cage_1 |
Flux_Tower_2 |
Biomass_Cage_2 |
Flux_Tower_3 |
Biomass_Cage_3 |
Flux_Tower_4 |
Biomass_Cage_4 |
Avg | Spacial Count |
Measurement Count |
|---|---|---|---|---|---|---|---|---|---|---|---|---|---|---|
| 2021-06-24 | 175 | 0 | nan | 0.7 | 0.4 | 7.5 | 4.2 | 3.9 | 12 | 11.6 | 15 | |||
| 2021-06-24 | 175 | 1 | nan | 0.1 | 0.1 | 7.8 | 4.2 | 4.2 | 12.3 | 11.3 | 15 | |||
| 2021-06-24 | 175 | Avg | 0-15cm | 0 | 0 | |||||||||
| 2021-06-24 | 175 | Avg | 15-30cm | 0 | 0 | |||||||||
| 2021-06-24 | 175 | Avg | 30-45cm | 0 | 0 | |||||||||
| 2021-06-24 | 175 | Avg | 45-60cm | 0 | 0 |
No TZ grass heigth found
No VR grass heigth found
Tree DBH
| Date | Tag# | Reading (mm) |
|---|---|---|
| 2021-06-24 | 1 | 13.7 |
| 2021-06-24 | 102 | 8.3 |
| 2021-06-24 | 2 | 13.8 |
| 2021-06-24 | 3 | 17.3 |
| 2021-06-24 | 4 | 11.9 |
| 2021-06-24 | 5 | 7.0 |
| 2021-06-24 | 6 | 20.7 |
| 2021-06-24 | 7 | 23.8 |
| 2021-06-24 | 72 | 12.6 |
| 2021-06-24 | 79 | 12.0 |
No water potential data found
No TZ Grass Biomass data found
No TZ OakLeaves Biomass data found
No TZ PineNeedles Biomass data found
1 photos found
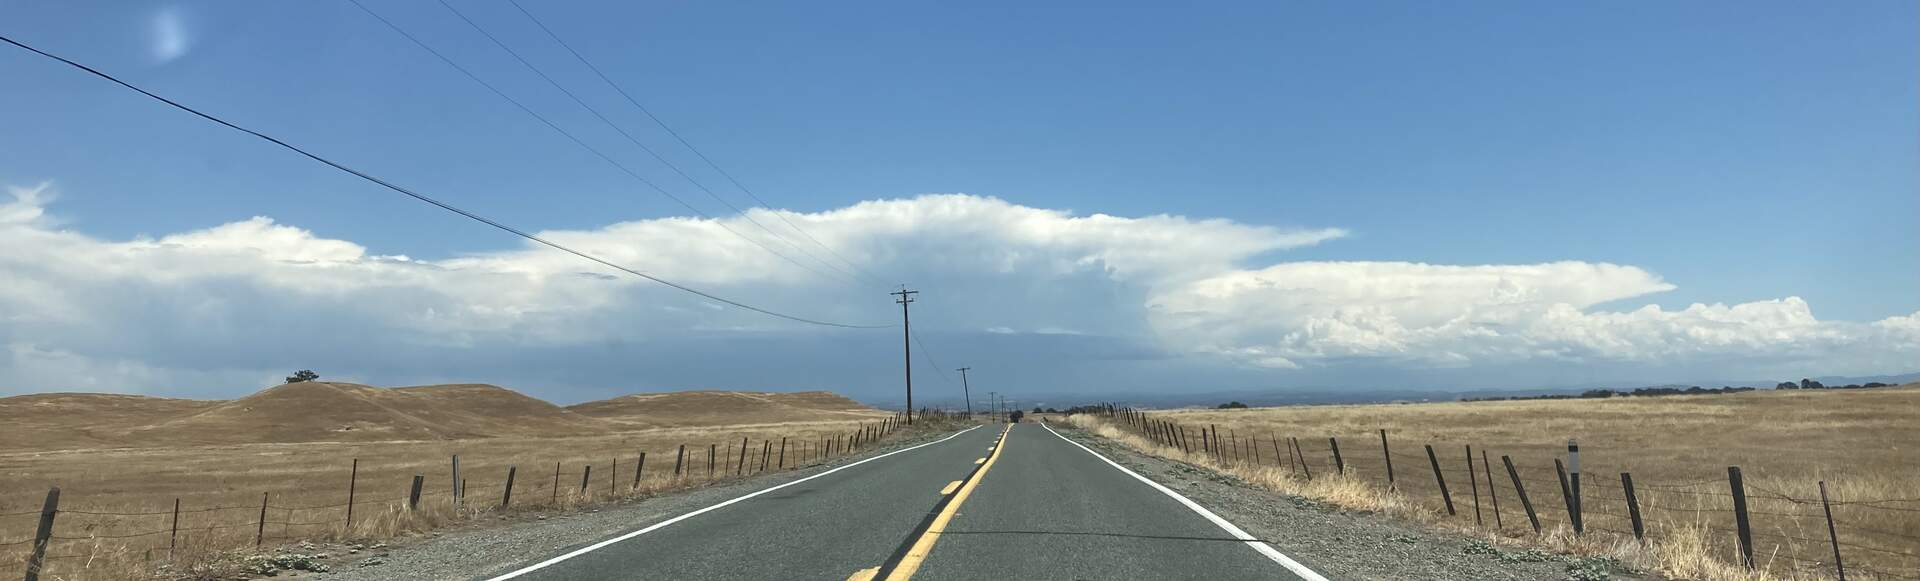
20210624TZ_Thunderheads.jpg ( 2021-06-24 13:08:07 ) Full size: 1920x581
Thunderheads over the mountains
16 sets found
No data found for TZ_Fenergy.
11 TZ_tmet graphs found
11 TZ_soilco2 graphs found
Can't check TZ_mixed
3 TZ_mixed graphs found
1 TZ_fflux graphs found
8 TZ_fmet graphs found
No data found for TZ_tram.
3 TZ_co2prof graphs found
1 TZ_irt graphs found
No data found for TZ_windprof.
1 TZ_tflux graphs found
2 TZ_sm graphs found
Can't check TZ_met
1 TZ_met graphs found
Can't check TZVR_mixed
8 TZ_osu graphs found
3 TZ_fd graphs found
Tonzi Z-cam data