
Field Notes
<--2021-03-25 13:45:00 | 2021-04-14 12:30:00-->Other sites visited today: Mayberry
Phenocam link: Searching...
Sherman Wetland: 2021-04-08 00:00:00 (DOY 98)
Author: Ariane Arias-Ortiz
Others: Camilo
Summary: Boardwalk installed at the hotspot location, testing of boat and sedpoint installation
| Camilo and I arrived at around 12 pm at Sherman Wetland. We picked up the plank and cinder blocks that Joe had left at the tower and drove to the hotspot location. With that we installed a boardwalk in the mudflat. Here. the water level was low, therefore we set up two chamber collars to measure soil-atmosphere flux rates and let them sit for a week prior to the day of the hotspot experiment. We installed sedpoints at 5, 10, 20, 30, 40, 50 cm depth. We drove back to the tower where we tested the boat. We inflated the boat at the berm in front of the tower boardwalk. Transported the boat to where the solar panels are and lowered it to the water. We boarded the boat from the solar panel scaffolding. We paddled to the 0.5 footprint, but we realized there wasn´t really a channel that would bring us out there. We paddled to a location where there wasn´t standing water lifted the boat and continued paddling in the other side to reach the 0.5 footprint. We tested the floating chamber there and then installed sedpoints down to 20 cm, the soils were very hard and compacted below this depth. The water level at the 0.5 footprint was above our knees so we walked back to the tower and exit the wetland through there. We realized that the easiest way to reach the 0.5 footprint site was to just walk with the boat to the open water patch in front of the tower, and paddle or push the boat to the sampling spot that we marked with a pink buoy. We left at around 4 pm |
4 photos found
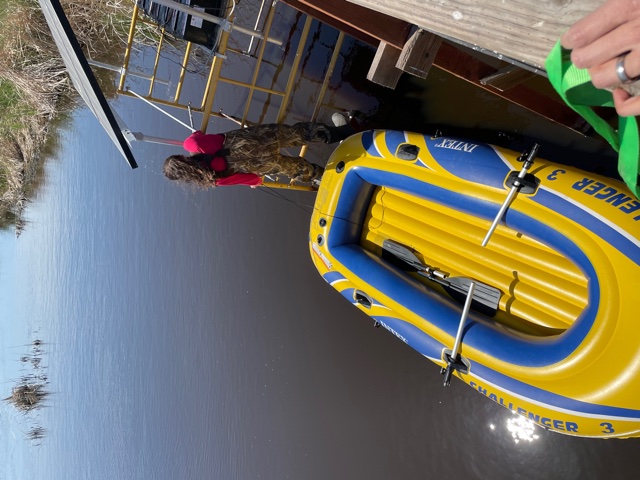
20210408SW_TestingInflatableBoat.jpg ( 2021-04-08 00:00:00 ) Full size: 640x480
Camilo and Ari figuring out how to access the 0.5 footprint area with the boat

20210408SW_BoardwalkatHotSpot.jpg ( 2021-04-08 00:00:00 ) Full size: 640x480
Boardwalk installed to do chamber work for Camilo´s hotspot experiment

20210408SW_OrangeBiofilm.jpg ( 2021-04-08 00:00:00 ) Full size: 1440x1920
There was a bright orange biofilm growing on the north levee side of SW

siwetland_2021_04_08_131405.jpg ( 2021-04-08 13:15:26 ) Full size: 1296x960
Ari and Camilo installing sedpoints at the open water location to prepare for methane hotspot sampling
7 sets found
Can't check MBWPEESWGT_mixed
Can't check MBEEWPSWEPGT_cam
16 SW_met graphs found
4 SW_flux graphs found
Can't check MBSWEEWPBCBA
Can't check SW_Temp
14 SW_Temp graphs found
3 SW_arable graphs found