Field Notes
<--2021-03-16 16:10:00 | 2021-04-08 00:00:00-->Other sites visited today: Hill Slough
Phenocam link: Searching...
Sherman Wetland: 2021-03-25 13:45:00 (DOY 84)
Author: Joe Verfaillie
Others: Daphne
Summary: Added sonic of inter-comparison, left boardwalk supplies for chamber work, fixed Phenocam clock.
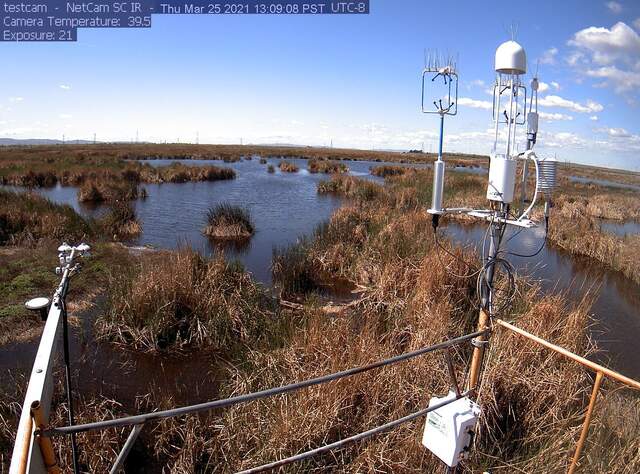
| Sherman Wetland 2021-03-25 Daphne and I arrived at 13:45 PDT. It was mild and breezy with some clouds on the horizon. Cattails are coming up everywhere but don’t look super lush. The water level was 97cm. This was a quick stop to add a sonic for inter-comparison and fix the Phenocam clock. We left one scaffolding boardwalk and three cinder blocks at the beginning of the wooden boardwalk for use with chamber measurements. I added sonic sn 153805 by adding another arm to the eddy mounts. I removed the bolt (it was almost frozen) that holds the existing sonic arm and added a second sonic arm on top with a longer bolt being careful not the move the existing sonic. The existing sonic heading is 10deg true and the inter-comparison sonic heading is 347deg true. The new sonic analog outs are connected to the 7700 analog in port. We set the coefficients on the 7700 analog ins (Aux 1-4) and added them to the USB output. The 7500 read 412ppm CO2, 352mmol/m3 H2O, 16.6C, 101.2kPa, 99SS The 7700 read 1.98ppm CH4, 52 RSSI Daphne downloaded the met, cam and flux data. We reset the Phenocam clock from 2000-01-14 19:55:48 to 2021-03-25 13:59:59. When we synced the clock to the computer it was an hour ahead. We tried a number of different time zones (PST, PST8, UTC-8). We ended up using UTC-7 but I’m not sure that the best solution. The laptop is using Pacific Time but not automatically adjusting to DST – I wonder if that is messing up the sync. We left at 14:30 |
2 photos found

siwetland_2021_03_25_130908.jpg ( 2021-03-25 13:09:08 ) Full size: 1296x960
Added 2nd sonic for sonic intercomparison

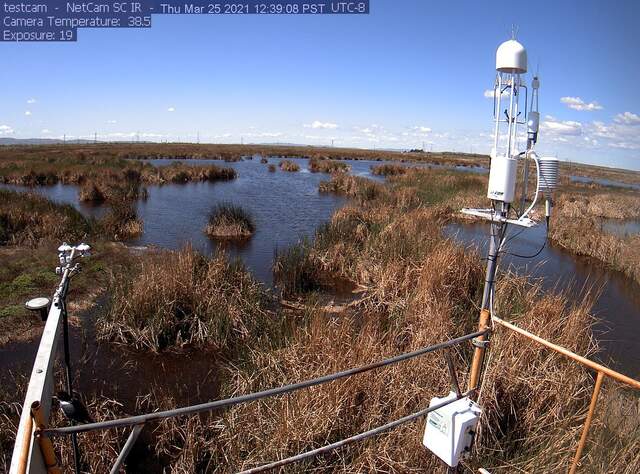
siwetland_2021_03_25_123908.jpg ( 2021-03-25 12:39:08 ) Full size: 1296x960
Kingfisher
7 sets found
Can't check MBWPEESWGT_mixed
Can't check MBEEWPSWEPGT_cam
16 SW_met graphs found
4 SW_flux graphs found
Can't check MBSWEEWPBCBA
Can't check SW_Temp
14 SW_Temp graphs found
3 SW_arable graphs found

