Field Notes
<--2021-02-18 15:00:00 | 2021-03-16 11:20:00-->Other sites visited today: Sherman Wetland | Mayberry | East End | West Pond | Bouldin Alfalfa
Phenocam link: Searching...
Bouldin Corn: 2021-03-04 14:55:00 (DOY 63)
Author: Daphne Szutu
Others:
Summary: Regular data collection/cleaning, swapped 7500 for calibration, changed eddy clocks +1min, new electronic gate by overpass, field is no longer flooded
| 2021-03-04 Bouldin Corn I arrived at 14:55 PST. It was a mild and slightly breezy day with blue skies and hazy horizons. The main red gate by the overpass has been converted into an electronic gate, so I parked outside the gate and walked in. There’s no standing water on our field now. I downloaded met, camera, and USB GHG data. I downloaded FD data and cleared its memory. I downloaded PA data and power-cycled the sensor. The wash reservoir was mostly full; I topped it off. I also cleaned the flux and rad sensors and swapped the desiccant for the water level sensor. The met enclosure still needs to be ground: I think the grounding anchor on the outside of the box is missing a bolt or screw to attach it to the enclosure. I swapped LI-7500s for calibration: sn 1594 came down and sn 75H-2514 went up. After the swap, I uploaded a new config file and updated the pressure coefficient. I also changed the eddy clocks from 15:12 to 15:13 to match the laptop time. I reset the 7550 box and checked that the USB was logging, the 7700 was connected, and the times still looked good. LI-7500 readings (sn 1594 --> sn 1594 after cleaning --> sn 75H-2514): CO2 415ppm --> 427 --> 424 H2O 452ppm --> 356 --> 368 T 19.2C --> 19.3 --> 20.7 P 102.2kPa --> 102.2 --> 102.2 SS 98--> 102 --> 101 LI7700 readings: CH4 2.1ppm RSSI 44-->73 after cleaning I left at 15:25 PST. |
1 photos found

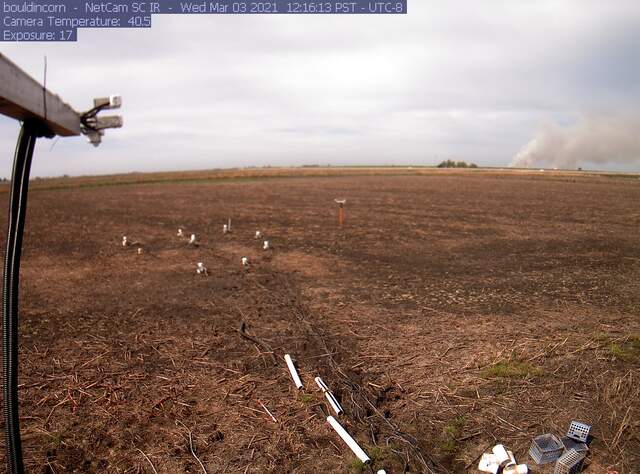
bouldincorn_2021_03_03_121505.jpg ( 2021-03-03 12:16:50 ) Full size: 1296x960
Smoke plume on the horizon
6 sets found
17 BC_met graphs found
5 BC_flux graphs found
Can't check TATWBABCSB_cam
Can't check MBSWEEWPBCBA
2 BC_pa graphs found
1 BC_arable graphs found

