
Field Notes
<--2021-01-05 10:40:00 | 2021-02-10 09:30:00-->Other sites visited today: Vaira | Bouldin Corn | Bouldin Alfalfa
Phenocam link: Searching...
Tonzi: 2021-01-21 09:20:00 (DOY 21)
Author: Joe Verfaillie
Others:
Summary: Rain is coming, installed comparison kit on tower top, moved IRT antenna, using new field laptop, z-cam one lost is clock setting.
| Tonzi 2021-01-21 I arrived at 9:20. It was clear, sunny and warm. I don’t think there has been any rain since the last visit but the forecast is for rain tomorrow and a wet week to come. The pond is as low as I have ever seen it. I met Rob on the way out. He’s busy fixing fences but the ground is still so hard it’s near impossible to get posts in. Rob says the beef prices are low and there is only about 60 head on the land. The cow ranchers are complaining about having to buy feed. I installed the comparison kit on the Tower top: CR1000 sn 4190 HMP155 sn S3410851 METER (ATMOS14) PAR incoming sn 990025 - channel 6 PAR incoming sn 990031 - channel 7 PAR incoming (Ameriflux) sn 060831 – channel 8. I did not determine which PAR was on which channel and I need to add serial numbers to the cable ends. The Ameriflux PAR is in the third channel. I’m using the new field laptop (datamule) for the first time. It is nice to have a fully functioning computer for a change. The only thing missing was a driver for the Global Water USB connection so I collected that data with the old white netbook with half a screen. The tower seemed fine. The IRT had not sent current data again even after moving the antenna last time. I moved the antenna again higher on the tripod post. The other OSU radio links are further away and going through the fiberglass enclosures so I’m not sure what is going on here. The Tower 7500 read: 422.4ppm CO2, 254.8mmol/m3 H2O, 15.9C, 99.4kPa, 99.2SS The Floor 7500 read: 424.4ppm CO2, 234.8mmol/m3 H2O, 15.9C, 99.4kPa, 99.3SS I collected the other data loggers, the FD chambers, the soil moisture, the DBH and manual well measurements. The IRTs pointing at the tree trunk were twisted off target. I realigned them. All else seemed well. I left for Vaira at about 13:00 In processing the data I found that z-cam one has lost its clock setting. I think either we got a bad set of coin cell batteries or the slot is wearing out and the slightly thicker ones make a better fit. |
Field Data
No tank data
Well Depth
| Date | Location | Depth (feet) |
|---|---|---|
| 2021-01-21 | TZ_floor | 31.75 |
| 2021-01-21 | TZ_road | 39.35 |
| 2021-01-21 | TZ_tower | 36.5 |
| 2021-01-21 | VR_well | 61 |
mode = both
Moisture Point Probes TZ
Array
(
[0] => Tower_1
[1] => Floor_South_1
[2] => Soil_Transect_4_1
[3] => Soil_Transect_3_1
[4] => Soil_Transect_2_1
[5] => Soil_Transect_1_1
[6] => SoilCO2_West_A_1
[7] => SoilCO2_West_B_1
[8] => SoilCO2_West_C_1
[9] => Tower_2
[10] => Floor_South_2
[11] => Floor_West_2
[12] => Soil_Transect_4_2
[13] => Soil_Transect_3_2
[14] => Soil_Transect_2_2
[15] => Soil_Transect_1_2
[16] => SoilCO2_West_A_2
[17] => SoilCO2_West_B_2
[18] => SoilCO2_West_C_2
[19] => Tower_3
[20] => Floor_South_3
[21] => Soil_Transect_4_3
[22] => Soil_Transect_3_3
[23] => Soil_Transect_2_3
[24] => Soil_Transect_1_3
[25] => SoilCO2_West_A_3
[26] => SoilCO2_West_B_3
[27] => SoilCO2_West_C_3
[28] => Tower_4
[29] => Floor_South_4
[30] => Soil_Transect_4_4
[31] => Soil_Transect_3_4
[32] => Soil_Transect_2_4
[33] => Soil_Transect_1_4
[34] => SoilCO2_West_A_4
[35] => SoilCO2_West_B_4
[36] => SoilCO2_West_C_4
[37] => Floor_West_1
)
| Date | DOY | Rep | Depth | Tower_1 |
Floor_South_1 |
Soil_Transect_4_1 |
Soil_Transect_3_1 |
Soil_Transect_2_1 |
Soil_Transect_1_1 |
SoilCO2_West_A_1 |
SoilCO2_West_B_1 |
SoilCO2_West_C_1 |
Tower_2 |
Floor_South_2 |
Floor_West_2 |
Soil_Transect_4_2 |
Soil_Transect_3_2 |
Soil_Transect_2_2 |
Soil_Transect_1_2 |
SoilCO2_West_A_2 |
SoilCO2_West_B_2 |
SoilCO2_West_C_2 |
Tower_3 |
Floor_South_3 |
Soil_Transect_4_3 |
Soil_Transect_3_3 |
Soil_Transect_2_3 |
Soil_Transect_1_3 |
SoilCO2_West_A_3 |
SoilCO2_West_B_3 |
SoilCO2_West_C_3 |
Tower_4 |
Floor_South_4 |
Soil_Transect_4_4 |
Soil_Transect_3_4 |
Soil_Transect_2_4 |
Soil_Transect_1_4 |
SoilCO2_West_A_4 |
SoilCO2_West_B_4 |
SoilCO2_West_C_4 |
Floor_West_1 |
Avg | Spacial Count |
Measurement Count |
|---|---|---|---|---|---|---|---|---|---|---|---|---|---|---|---|---|---|---|---|---|---|---|---|---|---|---|---|---|---|---|---|---|---|---|---|---|---|---|---|---|---|---|---|---|
| 2021-01-21 | 21 | 0 | nan | 11.5 | 8 | 4.5 | 8.8 | 11.2 | 2.4 | 20.9 | 15.9 | 8.6 | 12.7 | 12.4 | 12.4 | 10.6 | 24 | 19.1 | 5.4 | 17 | 6 | 17 | 13.1 | 9 | 9.5 | 13.4 | 16.2 | 12 | 18.2 | 10.9 | 10.3 | 15.9 | 5.6 | 10.5 | 12.2 | 22.2 | 12.8 | 12.5 | 11.1 | 12.5 | ||||
| 2021-01-21 | 21 | 1 | nan | 11.5 | 6.8 | 8.3 | 10.9 | 2.1 | 20.3 | 18.5 | 8.6 | 12.1 | 12.4 | 12.1 | 24 | 19.7 | 5.1 | 17.6 | 5.4 | 17 | 12.6 | 8.7 | 12.6 | 15.9 | 12.3 | 18.2 | 10.9 | 11.5 | 16.2 | 5.9 | 12.8 | 22.2 | 12.2 | 13.3 | 25.9 | 13 | 16.5 | |||||||
| 2021-01-21 | 21 | Avg | 0-15cm | 0 | 0 | |||||||||||||||||||||||||||||||||||||||
| 2021-01-21 | 21 | Avg | 15-30cm | 0 | 0 | |||||||||||||||||||||||||||||||||||||||
| 2021-01-21 | 21 | Avg | 30-45cm | 0 | 0 | |||||||||||||||||||||||||||||||||||||||
| 2021-01-21 | 21 | Avg | 45-60cm | 0 | 0 |
mode = both
Moisture Point Probes VR
Array
(
[0] => Flux_Tower_1
[1] => Biomass_Cage_1
[2] => Flux_Tower_2
[3] => Biomass_Cage_2
[4] => Flux_Tower_3
[5] => Biomass_Cage_3
[6] => Flux_Tower_4
[7] => Biomass_Cage_4
)
| Date | DOY | Rep | Depth | Flux_Tower_1 |
Biomass_Cage_1 |
Flux_Tower_2 |
Biomass_Cage_2 |
Flux_Tower_3 |
Biomass_Cage_3 |
Flux_Tower_4 |
Biomass_Cage_4 |
Avg | Spacial Count |
Measurement Count |
|---|---|---|---|---|---|---|---|---|---|---|---|---|---|---|
| 2021-01-21 | 21 | 0 | nan | 4.5 | 3.9 | 18.5 | 12.1 | 7 | 19 | 14.2 | 18.2 | |||
| 2021-01-21 | 21 | 1 | nan | 5 | 3.9 | 18.2 | 12.7 | 7.3 | 19.8 | 13.3 | 17.3 | |||
| 2021-01-21 | 21 | Avg | 0-15cm | 0 | 0 | |||||||||
| 2021-01-21 | 21 | Avg | 15-30cm | 0 | 0 | |||||||||
| 2021-01-21 | 21 | Avg | 30-45cm | 0 | 0 | |||||||||
| 2021-01-21 | 21 | Avg | 45-60cm | 0 | 0 |
No TZ grass heigth found
No VR grass heigth found
Tree DBH
| Date | Tag# | Reading (mm) |
|---|---|---|
| 2021-01-21 | 1 | 10.6 |
| 2021-01-21 | 102 | 5.7 |
| 2021-01-21 | 2 | 9.3 |
| 2021-01-21 | 245 | 13.0 |
| 2021-01-21 | 3 | 16.2 |
| 2021-01-21 | 4 | 10.1 |
| 2021-01-21 | 5 | 4.4 |
| 2021-01-21 | 6 | 16.4 |
| 2021-01-21 | 7 | 19.3 |
| 2021-01-21 | 72 | 10.4 |
| 2021-01-21 | 79 | 9.5 |
No water potential data found
No TZ Grass Biomass data found
No TZ OakLeaves Biomass data found
No TZ PineNeedles Biomass data found
2 photos found

20210121TZ_PARCompare.jpg ( 2021-01-21 00:00:00 ) Full size: 1440x1920
Comparing PAR sensors
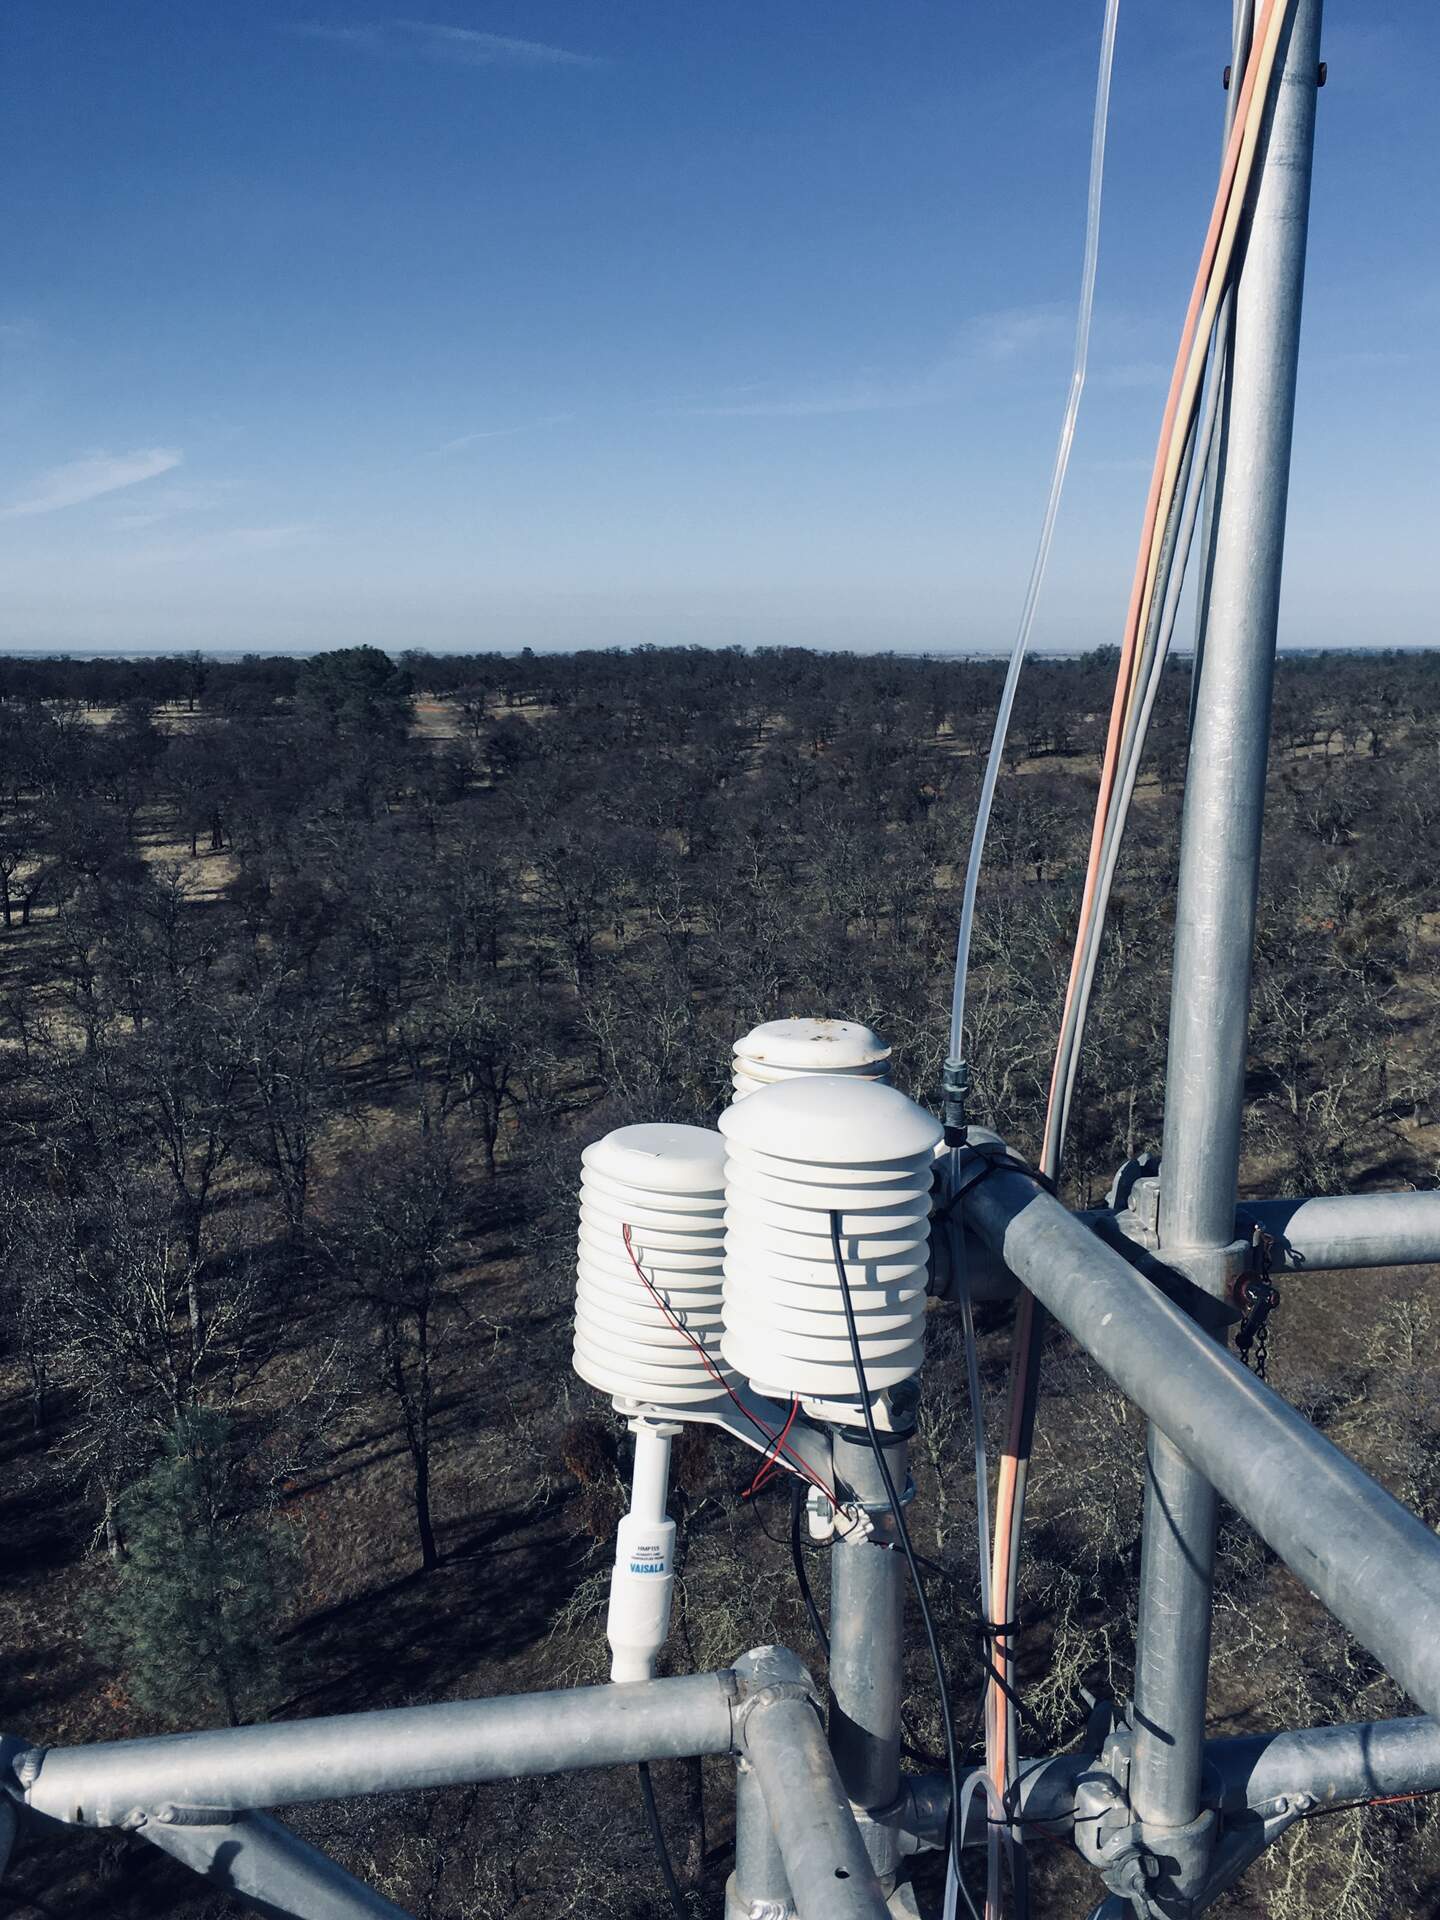
IMG_3003.jpg ( 2021-01-21 10:40:15 ) Full size: 1440x1920
Comparing AirT and RH
16 sets found
No data found for TZ_Fenergy.
11 TZ_tmet graphs found
11 TZ_soilco2 graphs found
Can't check TZ_mixed
3 TZ_mixed graphs found
1 TZ_fflux graphs found
8 TZ_fmet graphs found
No data found for TZ_tram.
3 TZ_co2prof graphs found
1 TZ_irt graphs found
No data found for TZ_windprof.
1 TZ_tflux graphs found
2 TZ_sm graphs found
Can't check TZ_met
1 TZ_met graphs found
Can't check TZVR_mixed
8 TZ_osu graphs found
3 TZ_fd graphs found
Tonzi Z-cam data