Field Notes
<--2020-12-18 09:30:00 | 2021-01-21 09:20:00-->Other sites visited today: Vaira
Phenocam link: Searching...
Tonzi: 2021-01-05 10:40:00 (DOY 5)
Author: Joe Verfaillie
Others:
Summary: Recent rain, young unsupervised cows broke the fences, Tower top HMP45 fan dead and replaced, new cable and mount for IRT CR1000 radio link, lowered Road well sensor, desiccant for z-cams
| Tonzi 2021-01-05 I arrived at 10:40. It was clear sunny and cool with a west breeze rising. There was rain the day before and the ground is wet but still hard. Some larger puddles on the road but no noticeable change in the pond. The trees are completely bare the rain having knocked off the last of the leaves. The grass is still poking along but is being held in check by the cold nights now. It’s very patchy but most 1-2cm in height. The mama cows have been removed leaving a bunch of young hoodlums that broke all the fences. I repaired the fence wires and turned on the electrical chargers since the fire danger has reduced. I collected the data, did the well, soil moisture and DBH measurements. The HMP fan at the top of the tower was dead. I took the shield apart, cleaned it and the HMP45, replaced the fan and put it back together. The radio link to the IRT CR1000 was down again. I replaced the antenna wire with a longer one and move the antenna to a new mount farther away from the metal structure of the tower and metal data logger box. We will see if that fixes it or not. The woodpeckers had stuffed this box full of acorns. The z-cams all had some condensation on the inside of their windows. I added desiccant packs to the boxes. Z-cam1 images were pretty much all bad due to the condensation – but no leaves on the tress right now. The road well sensor has been high and dry for a while. I removed its data logger box from the post and put in the ground next to the well pipe. This freed up a couple feet of cable and lower the sensor which read 1.682ft. I might need to bolt the box to the concrete pad to keep it from getting kicked around by the cows. And I don’t know the exact distance the sensor was lowered – need some more manual water level measurements. I collected the FD chamber data can cleared their memories. I left at 15:00 |
Field Data
No tank data
Well Depth
| Date | Location | Depth (feet) |
|---|---|---|
| 2021-01-05 | VR_well | 60.9 |
| 2021-01-05 | VR_pond | 13.77 |
| 2021-01-05 | TZ_road | 38.25 |
| 2021-01-05 | TZ_tower | 36.35 |
| 2021-01-05 | TZ_floor | 31.7 |
mode = both
Moisture Point Probes TZ
Array
(
[0] => Tower_1
[1] => Floor_South_1
[2] => Floor_West_1
[3] => Soil_Transect_4_1
[4] => Soil_Transect_3_1
[5] => Soil_Transect_2_1
[6] => Soil_Transect_1_1
[7] => SoilCO2_West_A_1
[8] => SoilCO2_West_B_1
[9] => SoilCO2_West_C_1
[10] => Tower_2
[11] => Floor_South_2
[12] => Floor_West_2
[13] => Soil_Transect_4_2
[14] => Soil_Transect_3_2
[15] => Soil_Transect_2_2
[16] => Soil_Transect_1_2
[17] => SoilCO2_West_A_2
[18] => SoilCO2_West_B_2
[19] => SoilCO2_West_C_2
[20] => Tower_3
[21] => Floor_South_3
[22] => Floor_West_3
[23] => Soil_Transect_4_3
[24] => Soil_Transect_3_3
[25] => Soil_Transect_2_3
[26] => Soil_Transect_1_3
[27] => SoilCO2_West_A_3
[28] => SoilCO2_West_B_3
[29] => SoilCO2_West_C_3
[30] => Tower_4
[31] => Floor_South_4
[32] => Floor_West_4
[33] => Soil_Transect_4_4
[34] => Soil_Transect_3_4
[35] => Soil_Transect_2_4
[36] => Soil_Transect_1_4
[37] => SoilCO2_West_A_4
[38] => SoilCO2_West_B_4
[39] => SoilCO2_West_C_4
)
| Date | DOY | Rep | Depth | Tower_1 |
Floor_South_1 |
Floor_West_1 |
Soil_Transect_4_1 |
Soil_Transect_3_1 |
Soil_Transect_2_1 |
Soil_Transect_1_1 |
SoilCO2_West_A_1 |
SoilCO2_West_B_1 |
SoilCO2_West_C_1 |
Tower_2 |
Floor_South_2 |
Floor_West_2 |
Soil_Transect_4_2 |
Soil_Transect_3_2 |
Soil_Transect_2_2 |
Soil_Transect_1_2 |
SoilCO2_West_A_2 |
SoilCO2_West_B_2 |
SoilCO2_West_C_2 |
Tower_3 |
Floor_South_3 |
Floor_West_3 |
Soil_Transect_4_3 |
Soil_Transect_3_3 |
Soil_Transect_2_3 |
Soil_Transect_1_3 |
SoilCO2_West_A_3 |
SoilCO2_West_B_3 |
SoilCO2_West_C_3 |
Tower_4 |
Floor_South_4 |
Floor_West_4 |
Soil_Transect_4_4 |
Soil_Transect_3_4 |
Soil_Transect_2_4 |
Soil_Transect_1_4 |
SoilCO2_West_A_4 |
SoilCO2_West_B_4 |
SoilCO2_West_C_4 |
Avg | Spacial Count |
Measurement Count |
|---|---|---|---|---|---|---|---|---|---|---|---|---|---|---|---|---|---|---|---|---|---|---|---|---|---|---|---|---|---|---|---|---|---|---|---|---|---|---|---|---|---|---|---|---|---|---|
| 2021-01-05 | 5 | 0 | nan | 16.2 | 10.3 | 23.2 | 12.1 | 13.2 | 16.2 | 5 | 26.1 | 22.3 | 12.1 | 12.1 | 11.1 | 13.9 | 11.2 | 24.9 | 20.3 | 5.1 | 18.8 | 8.4 | 18.2 | 14 | 9.8 | 39.6 | 9.5 | 10.3 | 15.1 | 12.6 | 15.9 | 10.3 | 11.5 | 15 | 5.6 | 41.4 | 10.5 | 14.2 | 21.6 | 11.9 | 12.8 | 11.1 | 12.5 | |||
| 2021-01-05 | 5 | 1 | nan | 15.3 | 9.7 | 11.1 | 11.2 | 13.8 | 16.2 | 5 | 26.7 | 23.2 | 13.2 | 12.1 | 7.8 | 13.9 | 10.6 | 25.5 | 20 | 5.4 | 18.8 | 8.1 | 17.6 | 13.7 | 9.8 | 39.6 | 9.5 | 10.9 | 15.1 | 11.7 | 16.5 | 10.9 | 11.5 | 15.6 | 5.6 | 41.4 | 10.2 | 14.5 | 21.6 | 12.5 | 12.8 | 11.1 | 12.8 | |||
| 2021-01-05 | 5 | Avg | 0-15cm | 0 | 0 | |||||||||||||||||||||||||||||||||||||||||
| 2021-01-05 | 5 | Avg | 15-30cm | 0 | 0 | |||||||||||||||||||||||||||||||||||||||||
| 2021-01-05 | 5 | Avg | 30-45cm | 0 | 0 | |||||||||||||||||||||||||||||||||||||||||
| 2021-01-05 | 5 | Avg | 45-60cm | 0 | 0 |
mode = both
Moisture Point Probes VR
Array
(
[0] => Flux_Tower_1
[1] => Biomass_Cage_1
[2] => Flux_Tower_2
[3] => Biomass_Cage_2
[4] => Flux_Tower_3
[5] => Biomass_Cage_3
[6] => Flux_Tower_4
[7] => Biomass_Cage_4
)
| Date | DOY | Rep | Depth | Flux_Tower_1 |
Biomass_Cage_1 |
Flux_Tower_2 |
Biomass_Cage_2 |
Flux_Tower_3 |
Biomass_Cage_3 |
Flux_Tower_4 |
Biomass_Cage_4 |
Avg | Spacial Count |
Measurement Count |
|---|---|---|---|---|---|---|---|---|---|---|---|---|---|---|
| 2021-01-05 | 5 | 0 | nan | 8.8 | 8.3 | 19.4 | 14.5 | 7.3 | 19.8 | 14.2 | 16.8 | |||
| 2021-01-05 | 5 | 1 | nan | 10.9 | 8 | 19.7 | 14.8 | 7.3 | 19.5 | 14.8 | 16.2 | |||
| 2021-01-05 | 5 | Avg | 0-15cm | 0 | 0 | |||||||||
| 2021-01-05 | 5 | Avg | 15-30cm | 0 | 0 | |||||||||
| 2021-01-05 | 5 | Avg | 30-45cm | 0 | 0 | |||||||||
| 2021-01-05 | 5 | Avg | 45-60cm | 0 | 0 |
No TZ grass heigth found
No VR grass heigth found
Tree DBH
| Date | Tag# | Reading (mm) |
|---|---|---|
| 2021-01-05 | 1 | 11.1 |
| 2021-01-05 | 102 | 7.6 |
| 2021-01-05 | 2 | 9.6 |
| 2021-01-05 | 245 | 13.4 |
| 2021-01-05 | 3 | 16.2 |
| 2021-01-05 | 4 | 10.2 |
| 2021-01-05 | 5 | 4.5 |
| 2021-01-05 | 6 | 16.5 |
| 2021-01-05 | 7 | 19.3 |
| 2021-01-05 | 72 | 10.6 |
| 2021-01-05 | 79 | 9.5 |
No water potential data found
No TZ Grass Biomass data found
No TZ OakLeaves Biomass data found
No TZ PineNeedles Biomass data found
2 photos found

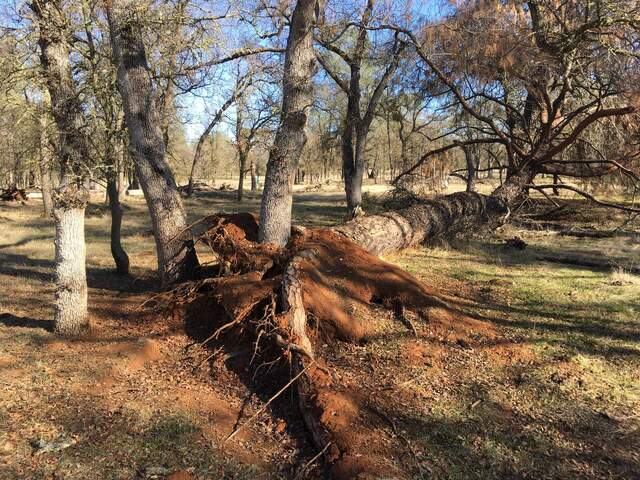
20210105TZ_DownPine.jpg ( 2021-01-05 00:00:00 ) Full size: 1920x1440
A pine fell some time ago near OSU SP3. Its roots were pulled loose right around some oaks.

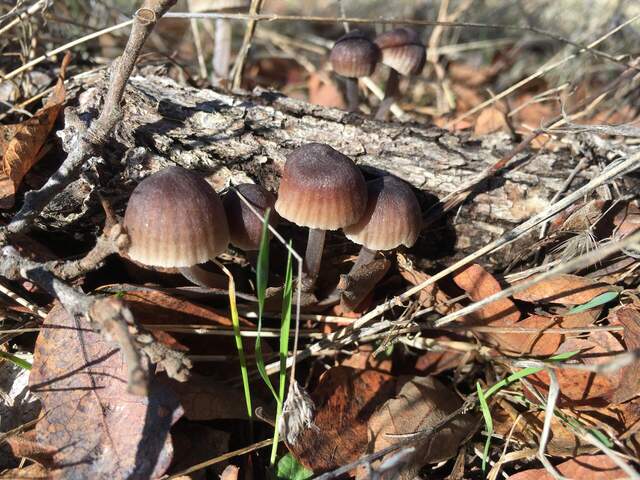
IMG_2985.jpg ( 2021-01-05 13:20:04 ) Full size: 1920x1440
some small mushrooms growing on a dead stick
16 sets found
No data found for TZ_Fenergy.
11 TZ_tmet graphs found
11 TZ_soilco2 graphs found
Can't check TZ_mixed
3 TZ_mixed graphs found
1 TZ_fflux graphs found
8 TZ_fmet graphs found
No data found for TZ_tram.
3 TZ_co2prof graphs found
1 TZ_irt graphs found
No data found for TZ_windprof.
1 TZ_tflux graphs found
2 TZ_sm graphs found
Can't check TZ_met
1 TZ_met graphs found
Can't check TZVR_mixed
8 TZ_osu graphs found
3 TZ_fd graphs found
Tonzi Z-cam data

