
Field Notes
<--2021-01-21 09:20:00 | 2021-03-02 11:30:00-->Other sites visited today: Vaira
Phenocam link: Searching...
Tonzi: 2021-02-10 09:30:00 (DOY 41)
Author: Joe Verfaillie
Others:
Summary: Water levels finally coming up after storm, Added sonic for comparison, removed PAR sensors from comparison, moved AMP PAR to reflected position, removed Theta 6.
| Tonzi 2021-02-21 I arrived at about 9:30. It was clear sunny and warm with a cool breeze from the west. There was a big storm about two weeks ago that brought lots of rain and wind. The pond level has come way up – maybe better than half full from close to zero. There were lots of small branches on the ground and probably several already dead trees have fallen over. It’s beginning to be hard to identify newly fallen trees because so many have fallen and not been cut up and removed for firewood in the last few years. A couple of battery box lids were blown loose and the water potential table was knocked over. It was a fairly clear day - I could see Rancho Seco but not snow in the mountains. I didn’t notice any problems in the data systems due to the storm except for maybe the Phenocam clock getting reset. The phenocam clock read 2020-01-11 08:48:54 when I reset it to 2021-02-10 10:40:57. At the tower I added the sonic sn 153805 that fell in the water at BC for an inter-comparison. It’s mounted on the post north of the permanent eddy sensors at the same height and oriented to true north. Its analog channels are wired into the comparison kit CR1000. I pushed the CR1000 program to 1Hz but it began skipping scans. We will compare 30min averages so I think it will be okay. I was looking at mV values but the numbers seemed a little off to me (W was higher and more positive than I expected). I removed PAR sn 990025 from Diff 6 and PAR sn 990031 from Diff 7. I moved the Ameriflux PAR sensor sn 060831 to Diff 6 and remounted it in the downward facing position for reflected PAR. The HMP155 and METER ATMOS14 will run a while longer. All the Tower data seemed okay but the IRT had not sent recent data again. I decided that a tree was blocking line of sight to the Tower and moved the antenna from its high southern position to a low northern position on the leg of the tripod. The Tower 7500 read: 427.4ppm CO2, 470.7mmol/m3 H2O, 15.3C, 99.3kPa, 99.3SS The Floor 7500 read: 425.5ppm CO2, 487.9mmol/m3 H2O, 15.9C, 99.5kPa, 99.0SS I collected the eddy, met, FD, DBH, well and moisture point data. The ground is close to saturated with values around 30%. I removed the Between Moisture Point rod sn 000000402FF3 that only has one or two good readings. The Global Water box at the Road well had been kicked around a bit by the cows but no harm done. I pulled the fence post it used to be mounted on so the cows don’t have a scratching post to draw them in near the well. The battery pack had two green meter lights and I swapped it out. I managed to get the new laptop connected to the Global Water logger after turning off some of the Windows security checks that was preventing the USB to serial driver from getting installed. Theta 6 has been reading a fixed value for a long while now. The ground is finally wet enough to dig it up. I found it located at the edge of the trees near the path to the tower. It was installed vertically with the top of the sensor 31cm below the ground surface (tines from 44-50cm deep). I didn’t see any damage to the wire. A shield wire was loose but connecting this didn’t change the reading. All the blue and red wires for all of the theta probes were jammed into the same ground port and SW12 power port. I spread the blue ground wires out but just cut the red power wire for Theta 6. A pluggable strip might be nice upgrade. I left a shovel sticking out of the hole and covered the hole with wood planks in case we can reinstall a probe. I left at about 13:40 |
Field Data
No tank data
Well Depth
| Date | Location | Depth (feet) |
|---|---|---|
| 2021-02-10 | TZ_floor | 31.4 |
| 2021-02-10 | TZ_road | 38.9 |
| 2021-02-10 | TZ_tower | 36.05 |
| 2021-02-10 | VR_well | 59.15 |
| 2021-02-10 | VR_pond | 20.04 |
mode = both
Moisture Point Probes TZ
Array
(
[0] => Tower_1
[1] => Floor_South_1
[2] => Soil_Transect_4_1
[3] => Soil_Transect_2_1
[4] => Soil_Transect_1_1
[5] => SoilCO2_West_A_1
[6] => SoilCO2_West_B_1
[7] => SoilCO2_West_C_1
[8] => Tower_2
[9] => Floor_South_2
[10] => Soil_Transect_4_2
[11] => Soil_Transect_3_2
[12] => Soil_Transect_2_2
[13] => Soil_Transect_1_2
[14] => SoilCO2_West_A_2
[15] => SoilCO2_West_B_2
[16] => SoilCO2_West_C_2
[17] => Tower_3
[18] => Floor_South_3
[19] => Soil_Transect_4_3
[20] => Soil_Transect_3_3
[21] => Soil_Transect_2_3
[22] => Soil_Transect_1_3
[23] => SoilCO2_West_A_3
[24] => SoilCO2_West_B_3
[25] => SoilCO2_West_C_3
[26] => Tower_4
[27] => Floor_South_4
[28] => Soil_Transect_4_4
[29] => Soil_Transect_3_4
[30] => Soil_Transect_2_4
[31] => Soil_Transect_1_4
[32] => SoilCO2_West_A_4
[33] => SoilCO2_West_B_4
[34] => SoilCO2_West_C_4
[35] => Soil_Transect_3_1
)
| Date | DOY | Rep | Depth | Tower_1 |
Floor_South_1 |
Soil_Transect_4_1 |
Soil_Transect_2_1 |
Soil_Transect_1_1 |
SoilCO2_West_A_1 |
SoilCO2_West_B_1 |
SoilCO2_West_C_1 |
Tower_2 |
Floor_South_2 |
Soil_Transect_4_2 |
Soil_Transect_3_2 |
Soil_Transect_2_2 |
Soil_Transect_1_2 |
SoilCO2_West_A_2 |
SoilCO2_West_B_2 |
SoilCO2_West_C_2 |
Tower_3 |
Floor_South_3 |
Soil_Transect_4_3 |
Soil_Transect_3_3 |
Soil_Transect_2_3 |
Soil_Transect_1_3 |
SoilCO2_West_A_3 |
SoilCO2_West_B_3 |
SoilCO2_West_C_3 |
Tower_4 |
Floor_South_4 |
Soil_Transect_4_4 |
Soil_Transect_3_4 |
Soil_Transect_2_4 |
Soil_Transect_1_4 |
SoilCO2_West_A_4 |
SoilCO2_West_B_4 |
SoilCO2_West_C_4 |
Soil_Transect_3_1 |
Avg | Spacial Count |
Measurement Count |
|---|---|---|---|---|---|---|---|---|---|---|---|---|---|---|---|---|---|---|---|---|---|---|---|---|---|---|---|---|---|---|---|---|---|---|---|---|---|---|---|---|---|---|
| 2021-02-10 | 41 | 0 | nan | 33.8 | 22.3 | 14.7 | 22.9 | 17.1 | 28.8 | 27.9 | 26.1 | 34.1 | 34.1 | 28 | 31 | 31.6 | 20.6 | 24.3 | 21 | 33.8 | 33.2 | 41 | 33.8 | 32.9 | 34.6 | 34.9 | 35.4 | 29 | 38.2 | 41.4 | 51.7 | 34.5 | 43.7 | 47.2 | 37.4 | 40 | 57.4 | 48.8 | ||||
| 2021-02-10 | 41 | 1 | nan | 34.9 | 21.7 | 14.4 | 22.3 | 17.3 | 31.4 | 27.9 | 27.9 | 33.5 | 34.7 | 28.9 | 30.7 | 32.3 | 21 | 24.6 | 20.3 | 31.9 | 33.2 | 40.2 | 34.3 | 33.8 | 34.6 | 34.6 | 34.9 | 24.6 | 38.5 | 42.8 | 50.9 | 34.2 | 44 | 46.6 | 36.8 | 40.5 | 11.1 | 48.3 | 20.3 | |||
| 2021-02-10 | 41 | Avg | 0-15cm | 0 | 0 | |||||||||||||||||||||||||||||||||||||
| 2021-02-10 | 41 | Avg | 15-30cm | 0 | 0 | |||||||||||||||||||||||||||||||||||||
| 2021-02-10 | 41 | Avg | 30-45cm | 0 | 0 | |||||||||||||||||||||||||||||||||||||
| 2021-02-10 | 41 | Avg | 45-60cm | 0 | 0 |
mode = both
Moisture Point Probes VR
Array
(
[0] => Flux_Tower_1
[1] => Flux_Tower_2
[2] => Flux_Tower_3
[3] => Biomass_Cage_3
[4] => Flux_Tower_4
[5] => Biomass_Cage_4
[6] => Biomass_Cage_1
[7] => Biomass_Cage_2
)
| Date | DOY | Rep | Depth | Flux_Tower_1 |
Flux_Tower_2 |
Flux_Tower_3 |
Biomass_Cage_3 |
Flux_Tower_4 |
Biomass_Cage_4 |
Biomass_Cage_1 |
Biomass_Cage_2 |
Avg | Spacial Count |
Measurement Count |
|---|---|---|---|---|---|---|---|---|---|---|---|---|---|---|
| 2021-02-10 | 41 | 0 | nan | 12.1 | 30.7 | 17 | 29 | 29.1 | 27.4 | |||||
| 2021-02-10 | 41 | 1 | nan | 13.8 | 31 | 16.8 | 31 | 28.8 | 31.4 | 9.1 | 19.7 | |||
| 2021-02-10 | 41 | 2 | nan | 30.7 | 32.2 | 9.4 | 20 | |||||||
| 2021-02-10 | 41 | Avg | 0-15cm | 0 | 0 | |||||||||
| 2021-02-10 | 41 | Avg | 15-30cm | 0 | 0 | |||||||||
| 2021-02-10 | 41 | Avg | 30-45cm | 0 | 0 | |||||||||
| 2021-02-10 | 41 | Avg | 45-60cm | 0 | 0 |
No TZ grass heigth found
No VR grass heigth found
Tree DBH
| Date | Tag# | Reading (mm) |
|---|---|---|
| 2021-02-10 | 1 | 12.0 |
| 2021-02-10 | 102 | 9.3 |
| 2021-02-10 | 2 | 12.1 |
| 2021-02-10 | 245 | 13.7 |
| 2021-02-10 | 3 | 17.25 |
| 2021-02-10 | 4 | 11.2 |
| 2021-02-10 | 5 | 4.5 |
| 2021-02-10 | 6 | 16.8 |
| 2021-02-10 | 7 | 19.6 |
| 2021-02-10 | 72 | 11.6 |
| 2021-02-10 | 79 | 10.5 |
No water potential data found
No TZ Grass Biomass data found
No TZ OakLeaves Biomass data found
No TZ PineNeedles Biomass data found
1 photos found
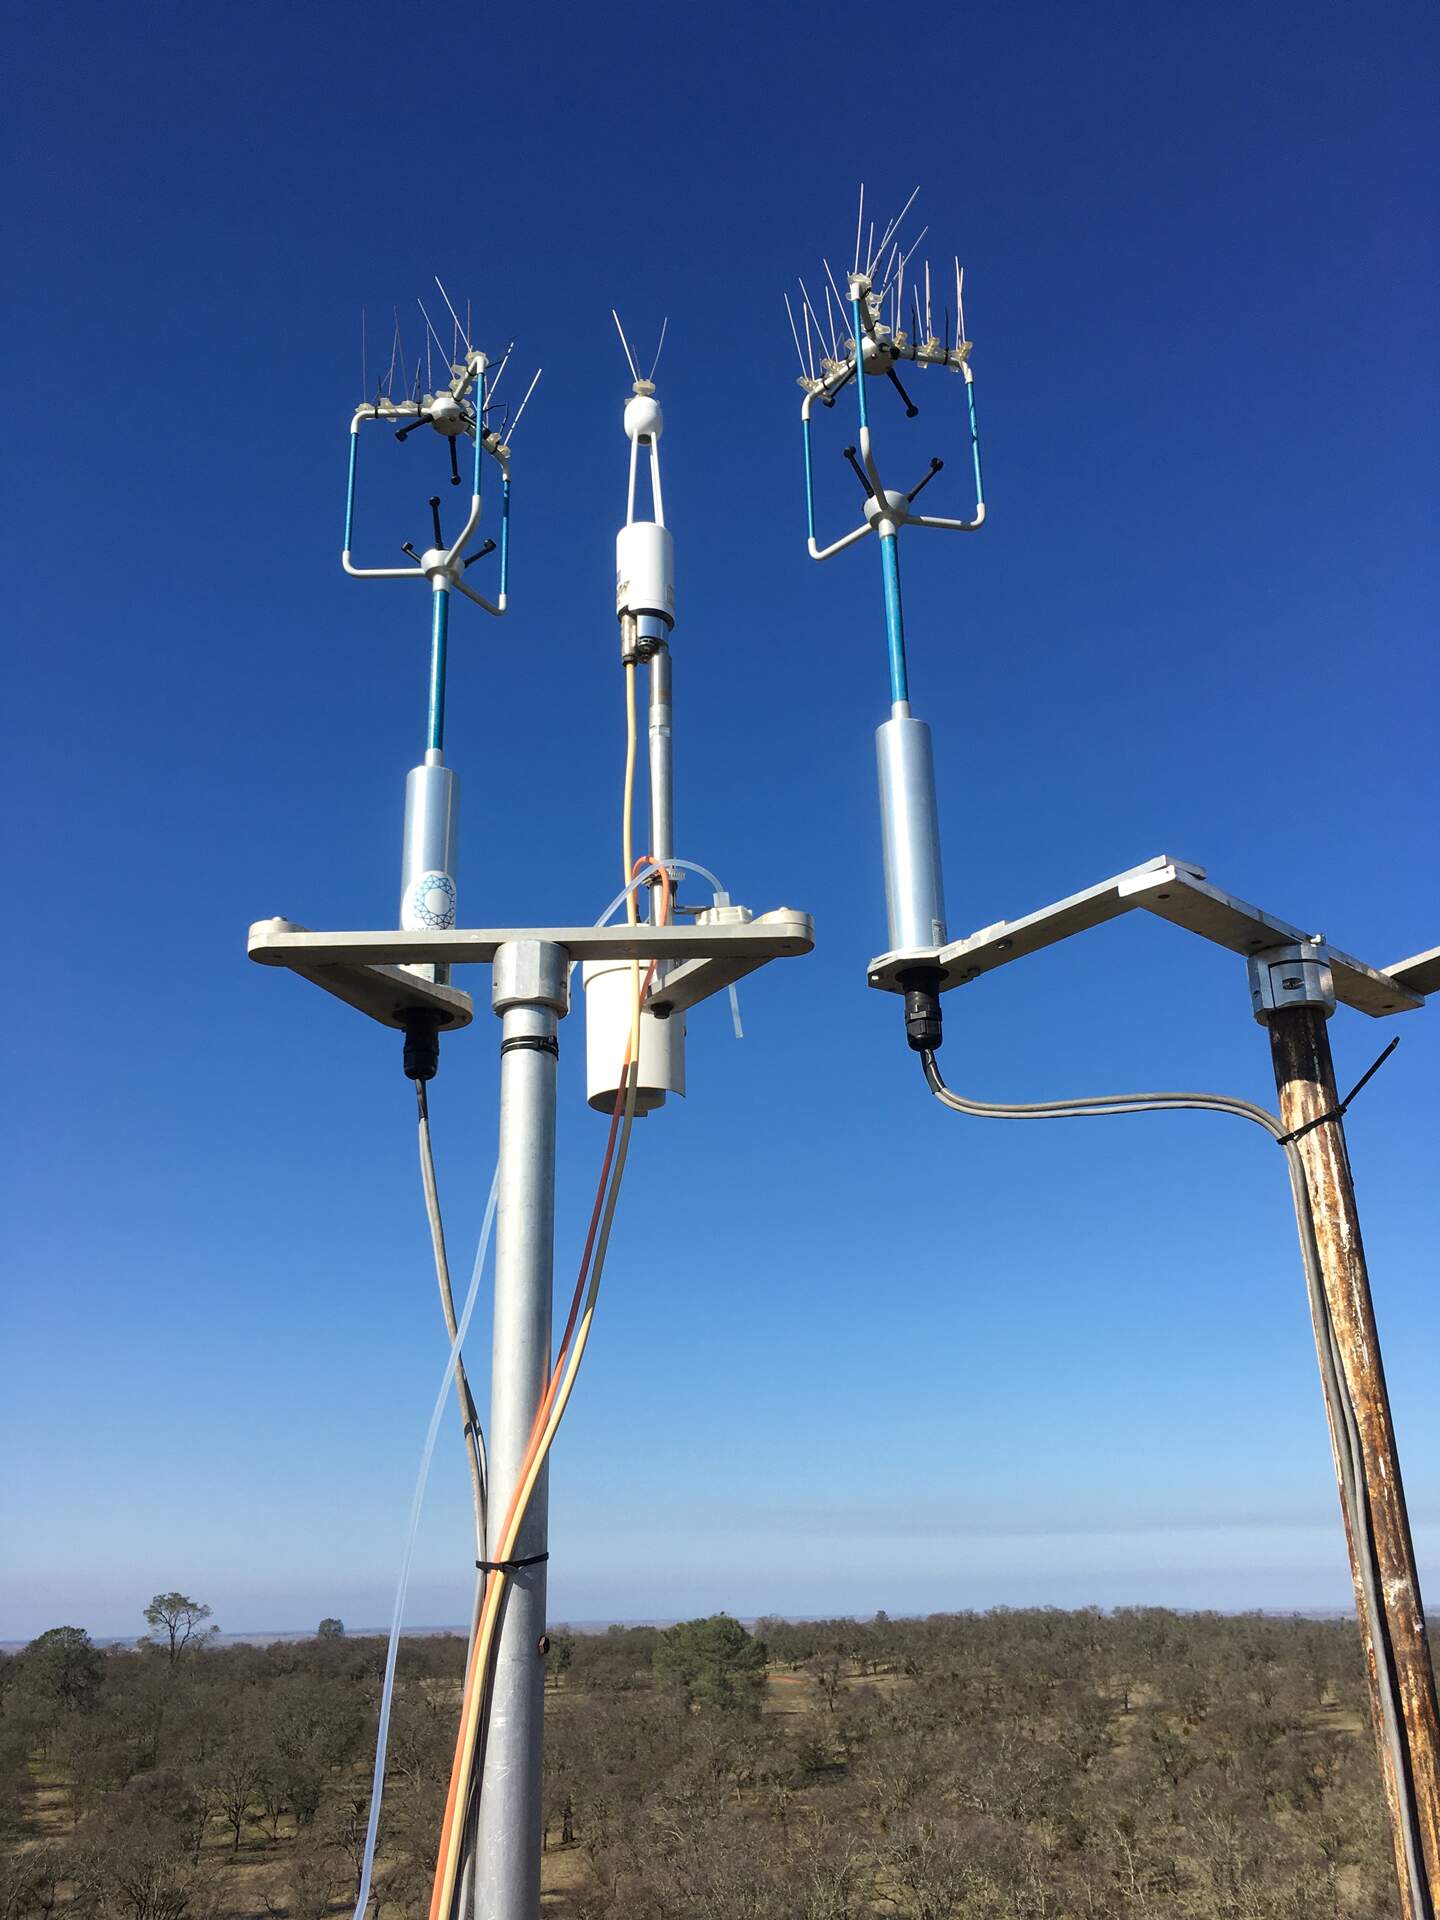
2020210TZ_SonicCompare.jpg ( 2021-02-10 10:18:10 ) Full size: 1440x1920
Comparing the sonic that got wet when the corn tower fell over.
16 sets found
No data found for TZ_Fenergy.
11 TZ_tmet graphs found
11 TZ_soilco2 graphs found
Can't check TZ_mixed
3 TZ_mixed graphs found
1 TZ_fflux graphs found
8 TZ_fmet graphs found
No data found for TZ_tram.
3 TZ_co2prof graphs found
1 TZ_irt graphs found
No data found for TZ_windprof.
1 TZ_tflux graphs found
2 TZ_sm graphs found
Can't check TZ_met
1 TZ_met graphs found
Can't check TZVR_mixed
8 TZ_osu graphs found
3 TZ_fd graphs found
Tonzi Z-cam data