Field Notes
<--2020-12-01 12:00:00 | 2021-01-05 10:40:00-->Other sites visited today: Vaira | Bouldin Alfalfa
Phenocam link: Searching...
Tonzi: 2020-12-18 09:30:00 (DOY 353)
Author: Joe Verfaillie
Others:
Summary: First real rain but not much, New tenant at Tonzi's house, Removed OSU SP1 tipping bucket for lab experiments. Grass is sprouting everywhere
| Tonzi 2020-12-18 I arrived at about 9:30. It was clear and sunny and cool – I saw the fog lifting as I drove in from Sacramento. There had been the first real rain a couple days ago. The ground was so dry that it just sucked up all the rain. There were a couple of puddles on the road but otherwise the ground was still hard and almost dry in sunny spots. Grass has sprouted everywhere giving the ground a green tint. I met the new tenant and his black Labrador now living in Mr Tonzi’s house. The man had an idea of the science we are pursuing and his wife is related to the SMAP soil moisture project in some way. I gave him my contact information – not sure I’ll hear from him or not. The Tower seemed to be running fine. Most of the data was on the Tower computer – cycling the power on the IRT CR1000 reestablished the radio connection and got that data up to date. The antenna was okay this time. I guess I’ll have to use the loner cable and get the antenna in a better spot. The Tower 7500 read: 434.3ppm CO2, 351.9mmol/m3 H2O, 8.7C, 100.1kPa, 98.8SS I forgot to check the power connections on the Tower top CR1000 but there was no missing data this time. Maybe cycling its power last time fixed the issue. I collected the Floor data, the other data loggers, serviced the z-cams and the FD chambers. I did the Moisture Point readings, well depth and DBH readings. The Moisture Point probe near the Floor tower was loose in the ground and moved up a few centimeters when I pulled the cap off. The Floor 7500 read: 432.3ppm CO2, 379.5mmol/m3 H2O, 9.8C, 100.2kPa, 99.1SS I removed the tipping bucket sn 48130-611 from the OSU SP1 system for experiments in the lab. I disconnected the cable inside the bucket so I didn’t have to pull the cable out of the ground but that means we will have to add some wire in the lab to use it. I left at about noon for Vaira |
Field Data
No tank data
Well Depth
| Date | Location | Depth (feet) |
|---|---|---|
| 2020-12-18 | TZ_floor | 31.6 |
| 2020-12-18 | TZ_road | 39.15 |
| 2020-12-18 | TZ_tower | 36.2 |
| 2020-12-18 | VR_well | 60.8 |
| 2020-12-18 | VR_pond | 13.88 |
mode = both
Moisture Point Probes TZ
Array
(
[0] => Tower_1
[1] => Floor_South_1
[2] => Soil_Transect_4_1
[3] => Soil_Transect_3_1
[4] => Soil_Transect_2_1
[5] => Soil_Transect_1_1
[6] => SoilCO2_West_A_1
[7] => SoilCO2_West_B_1
[8] => SoilCO2_West_C_1
[9] => Tower_2
[10] => Floor_South_2
[11] => Floor_West_2
[12] => Soil_Transect_4_2
[13] => Soil_Transect_3_2
[14] => Soil_Transect_2_2
[15] => Soil_Transect_1_2
[16] => SoilCO2_West_A_2
[17] => SoilCO2_West_B_2
[18] => SoilCO2_West_C_2
[19] => Tower_3
[20] => Floor_South_3
[21] => Floor_West_3
[22] => Soil_Transect_4_3
[23] => Soil_Transect_3_3
[24] => Soil_Transect_2_3
[25] => Soil_Transect_1_3
[26] => SoilCO2_West_A_3
[27] => SoilCO2_West_B_3
[28] => SoilCO2_West_C_3
[29] => Tower_4
[30] => Floor_South_4
[31] => Soil_Transect_4_4
[32] => Soil_Transect_3_4
[33] => Soil_Transect_2_4
[34] => Soil_Transect_1_4
[35] => SoilCO2_West_A_4
[36] => SoilCO2_West_B_4
[37] => SoilCO2_West_C_4
[38] => Floor_West_1
)
| Date | DOY | Rep | Depth | Tower_1 |
Floor_South_1 |
Soil_Transect_4_1 |
Soil_Transect_3_1 |
Soil_Transect_2_1 |
Soil_Transect_1_1 |
SoilCO2_West_A_1 |
SoilCO2_West_B_1 |
SoilCO2_West_C_1 |
Tower_2 |
Floor_South_2 |
Floor_West_2 |
Soil_Transect_4_2 |
Soil_Transect_3_2 |
Soil_Transect_2_2 |
Soil_Transect_1_2 |
SoilCO2_West_A_2 |
SoilCO2_West_B_2 |
SoilCO2_West_C_2 |
Tower_3 |
Floor_South_3 |
Floor_West_3 |
Soil_Transect_4_3 |
Soil_Transect_3_3 |
Soil_Transect_2_3 |
Soil_Transect_1_3 |
SoilCO2_West_A_3 |
SoilCO2_West_B_3 |
SoilCO2_West_C_3 |
Tower_4 |
Floor_South_4 |
Soil_Transect_4_4 |
Soil_Transect_3_4 |
Soil_Transect_2_4 |
Soil_Transect_1_4 |
SoilCO2_West_A_4 |
SoilCO2_West_B_4 |
SoilCO2_West_C_4 |
Floor_West_1 |
Avg | Spacial Count |
Measurement Count |
|---|---|---|---|---|---|---|---|---|---|---|---|---|---|---|---|---|---|---|---|---|---|---|---|---|---|---|---|---|---|---|---|---|---|---|---|---|---|---|---|---|---|---|---|---|---|
| 2020-12-18 | 353 | 0 | nan | 17.9 | 10 | 3.3 | 11.2 | 16.2 | 5.6 | 24.1 | 21.4 | 13 | 11.8 | 7.8 | 10.9 | 11.8 | 20 | 17 | 5.4 | 16.7 | 7.8 | 15.8 | 13.4 | 8.4 | 39.6 | 9.5 | 11.2 | 15.1 | 12.3 | 12.9 | 6.7 | 9.2 | 15.3 | 11.1 | 10.2 | 15.6 | 20.8 | 11.9 | 13 | 23.6 | 12.8 | ||||
| 2020-12-18 | 353 | 1 | nan | 18.8 | 9.7 | 4.5 | 11.8 | 15.9 | 5.6 | 23.5 | 23.5 | 13.5 | 10.9 | 8.7 | 11.8 | 10.9 | 20 | 16.7 | 5.7 | 15.8 | 9 | 15.5 | 12.3 | 9.2 | 39.6 | 9.5 | 10.6 | 14.8 | 12.9 | 12.3 | 4.8 | 8.7 | 15 | 5.6 | 10.2 | 15.9 | 21.6 | 12.2 | 12.5 | 23.4 | 12.5 | 22 | |||
| 2020-12-18 | 353 | Avg | 0-15cm | 0 | 0 | ||||||||||||||||||||||||||||||||||||||||
| 2020-12-18 | 353 | Avg | 15-30cm | 0 | 0 | ||||||||||||||||||||||||||||||||||||||||
| 2020-12-18 | 353 | Avg | 30-45cm | 0 | 0 | ||||||||||||||||||||||||||||||||||||||||
| 2020-12-18 | 353 | Avg | 45-60cm | 0 | 0 |
mode = both
Moisture Point Probes VR
Array
(
[0] => Flux_Tower_1
[1] => Biomass_Cage_1
[2] => Flux_Tower_2
[3] => Biomass_Cage_2
[4] => Flux_Tower_3
[5] => Biomass_Cage_3
[6] => Flux_Tower_4
[7] => Biomass_Cage_4
)
| Date | DOY | Rep | Depth | Flux_Tower_1 |
Biomass_Cage_1 |
Flux_Tower_2 |
Biomass_Cage_2 |
Flux_Tower_3 |
Biomass_Cage_3 |
Flux_Tower_4 |
Biomass_Cage_4 |
Avg | Spacial Count |
Measurement Count |
|---|---|---|---|---|---|---|---|---|---|---|---|---|---|---|
| 2020-12-18 | 353 | 0 | nan | 8.6 | 7.1 | 18.8 | 14.2 | 3.7 | 15.1 | 13.9 | 14.8 | |||
| 2020-12-18 | 353 | 1 | nan | 7.7 | 6.5 | 19.4 | 14.2 | 3.9 | 14.8 | 14.5 | 14.5 | |||
| 2020-12-18 | 353 | Avg | 0-15cm | 0 | 0 | |||||||||
| 2020-12-18 | 353 | Avg | 15-30cm | 0 | 0 | |||||||||
| 2020-12-18 | 353 | Avg | 30-45cm | 0 | 0 | |||||||||
| 2020-12-18 | 353 | Avg | 45-60cm | 0 | 0 |
No TZ grass heigth found
No VR grass heigth found
Tree DBH
| Date | Tag# | Reading (mm) |
|---|---|---|
| 2020-12-18 | 1 | 11.1 |
| 2020-12-18 | 102 | 8.3 |
| 2020-12-18 | 2 | 9.4 |
| 2020-12-18 | 245 | 13.8 |
| 2020-12-18 | 3 | 16.1 |
| 2020-12-18 | 4 | 10.2 |
| 2020-12-18 | 5 | 4.7 |
| 2020-12-18 | 6 | 16.5 |
| 2020-12-18 | 7 | 19.3 |
| 2020-12-18 | 72 | 10.6 |
| 2020-12-18 | 79 | 9.5 |
No water potential data found
No TZ Grass Biomass data found
No TZ OakLeaves Biomass data found
No TZ PineNeedles Biomass data found
2 photos found

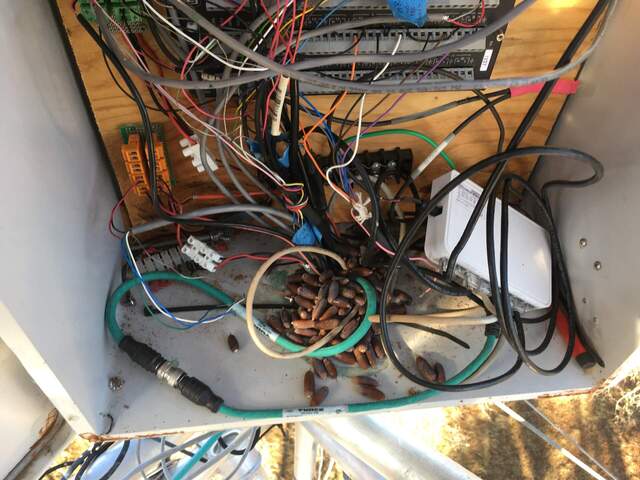
IMG_2953.jpg ( 2020-12-18 10:03:19 ) Full size: 1920x1440
The woodpeckers have been busy stuffing acorns in every hole they can find.

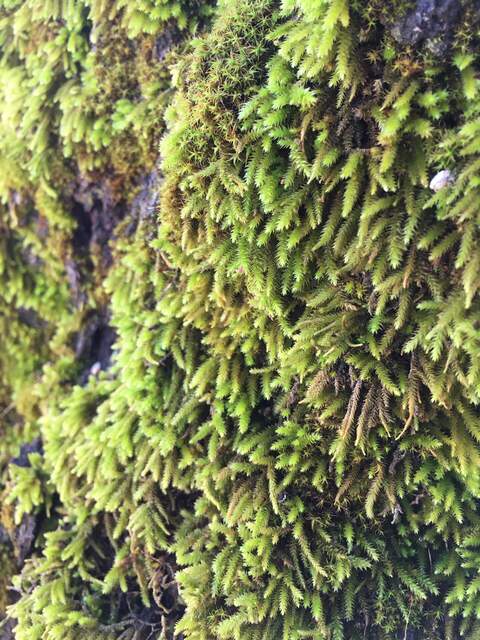
IMG_2955.jpg ( 2020-12-18 11:22:59 ) Full size: 1440x1920
First real rain has made the moss happy
16 sets found
No data found for TZ_Fenergy.
11 TZ_tmet graphs found
11 TZ_soilco2 graphs found
Can't check TZ_mixed
3 TZ_mixed graphs found
1 TZ_fflux graphs found
8 TZ_fmet graphs found
No data found for TZ_tram.
3 TZ_co2prof graphs found
1 TZ_irt graphs found
No data found for TZ_windprof.
1 TZ_tflux graphs found
2 TZ_sm graphs found
Can't check TZ_met
1 TZ_met graphs found
Can't check TZVR_mixed
8 TZ_osu graphs found
3 TZ_fd graphs found
Tonzi Z-cam data

