
Field Notes
<--2020-05-05 12:15:00 | 2020-05-23 12:00:00-->Other sites visited today: Vaira | Tonzi
Phenocam link: Searching...
Tonzi: 2020-05-23 10:30:00 (DOY 144)
Author: Siyan Ma
Others: Joe, Ray, Sunny
Summary: Standard fieldwork, grasses almost dead at VR, first midday water potential, clip plots
|
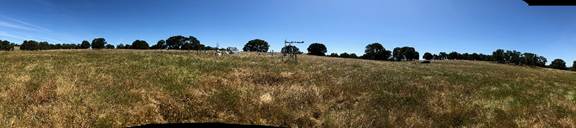
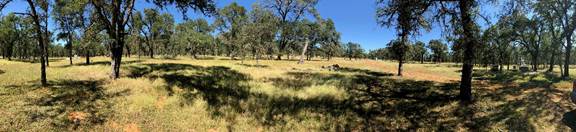
When: Date: 5/23/2019 , Day: 143 , Watch Time: 11:00 am . Where: Tonzi/Vaira Ranch Who: Siyan, Joe Weather: clear, sunny Phenology: Annual grasses are senescent, >90% at Vaira; ~ 50% at Tonzi.
Summary
Vaira_Grass Site
Tonzi_Tower Site
Toniz_Floor Site
|
Field Data
No tank data
Well Depth
| Date | Location | Depth (feet) |
|---|---|---|
| 2020-05-23 | VR_well | 54.7 |
| 2020-05-23 | TZ_floor | 26.9 |
| 2020-05-23 | TZ_tower | 31 |
| 2020-05-23 | TZ_road | 35.8 |
mode = both
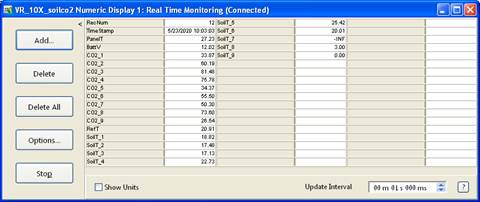
Moisture Point Probes TZ
Array
(
[0] => Tower_1
[1] => Floor_South_1
[2] => Floor_West_1
[3] => Soil_Transect_4_1
[4] => Soil_Transect_3_1
[5] => Soil_Transect_2_1
[6] => Soil_Transect_1_1
[7] => SoilCO2_West_A_1
[8] => SoilCO2_West_C_1
[9] => Tower_2
[10] => Floor_South_2
[11] => Floor_West_2
[12] => Soil_Transect_4_2
[13] => Soil_Transect_3_2
[14] => Soil_Transect_2_2
[15] => Soil_Transect_1_2
[16] => SoilCO2_West_A_2
[17] => SoilCO2_West_C_2
[18] => Tower_3
[19] => Floor_South_3
[20] => Floor_West_3
[21] => Soil_Transect_4_3
[22] => Soil_Transect_3_3
[23] => Soil_Transect_2_3
[24] => Soil_Transect_1_3
[25] => SoilCO2_West_A_3
[26] => SoilCO2_West_C_3
[27] => Tower_4
[28] => Floor_South_4
[29] => Floor_West_4
[30] => Soil_Transect_4_4
[31] => Soil_Transect_3_4
[32] => Soil_Transect_2_4
[33] => Soil_Transect_1_4
[34] => SoilCO2_West_A_4
[35] => SoilCO2_West_C_4
)
| Date | DOY | Rep | Depth | Tower_1 |
Floor_South_1 |
Floor_West_1 |
Soil_Transect_4_1 |
Soil_Transect_3_1 |
Soil_Transect_2_1 |
Soil_Transect_1_1 |
SoilCO2_West_A_1 |
SoilCO2_West_C_1 |
Tower_2 |
Floor_South_2 |
Floor_West_2 |
Soil_Transect_4_2 |
Soil_Transect_3_2 |
Soil_Transect_2_2 |
Soil_Transect_1_2 |
SoilCO2_West_A_2 |
SoilCO2_West_C_2 |
Tower_3 |
Floor_South_3 |
Floor_West_3 |
Soil_Transect_4_3 |
Soil_Transect_3_3 |
Soil_Transect_2_3 |
Soil_Transect_1_3 |
SoilCO2_West_A_3 |
SoilCO2_West_C_3 |
Tower_4 |
Floor_South_4 |
Floor_West_4 |
Soil_Transect_4_4 |
Soil_Transect_3_4 |
Soil_Transect_2_4 |
Soil_Transect_1_4 |
SoilCO2_West_A_4 |
SoilCO2_West_C_4 |
Avg | Spacial Count |
Measurement Count |
|---|---|---|---|---|---|---|---|---|---|---|---|---|---|---|---|---|---|---|---|---|---|---|---|---|---|---|---|---|---|---|---|---|---|---|---|---|---|---|---|---|---|---|
| 2020-05-23 | 144 | 0 | nan | 10.3 | 1.8 | 11.1 | 6.8 | 14.4 | 9.4 | 3 | 16.2 | 7.4 | 12.7 | 13.6 | 12.1 | 10 | 15.5 | 15.2 | 5.4 | 9.7 | 15.5 | 17.6 | 21.2 | 19 | 12.9 | 17.9 | 20.7 | 17.3 | 18.7 | 19 | 24.8 | 16.2 | 24.5 | 15 | 28.5 | 34.5 | 17.6 | 23.6 | 25.9 | |||
| 2020-05-23 | 144 | 1 | nan | 9.7 | 1.8 | 9.1 | 7.4 | 14.7 | 10.3 | 2.4 | 16.5 | 8.6 | 12.1 | 13.3 | 12.1 | 10.3 | 15.8 | 15.5 | 5.4 | 10 | 14.5 | 16.8 | 20.9 | 16.2 | 12.6 | 18.2 | 20.9 | 17.3 | 19.3 | 14.8 | 23.6 | 16.2 | 28.2 | 14 | 28.2 | 34.5 | 17.3 | 22.5 | 16.2 | |||
| 2020-05-23 | 144 | Avg | 0-15cm | 0 | 0 | |||||||||||||||||||||||||||||||||||||
| 2020-05-23 | 144 | Avg | 15-30cm | 0 | 0 | |||||||||||||||||||||||||||||||||||||
| 2020-05-23 | 144 | Avg | 30-45cm | 0 | 0 | |||||||||||||||||||||||||||||||||||||
| 2020-05-23 | 144 | Avg | 45-60cm | 0 | 0 |
mode = both
Moisture Point Probes VR
Array
(
[0] => Flux_Tower_1
[1] => Biomass_Cage_1
[2] => Flux_Tower_2
[3] => Biomass_Cage_2
[4] => Flux_Tower_3
[5] => Biomass_Cage_3
[6] => Flux_Tower_4
[7] => Biomass_Cage_4
)
| Date | DOY | Rep | Depth | Flux_Tower_1 |
Biomass_Cage_1 |
Flux_Tower_2 |
Biomass_Cage_2 |
Flux_Tower_3 |
Biomass_Cage_3 |
Flux_Tower_4 |
Biomass_Cage_4 |
Avg | Spacial Count |
Measurement Count |
|---|---|---|---|---|---|---|---|---|---|---|---|---|---|---|
| 2020-05-23 | 144 | 0 | nan | 5 | 3.3 | 11.5 | 11.1 | 4.2 | 15.9 | 15.9 | 13.6 | |||
| 2020-05-23 | 144 | 1 | nan | 5.9 | 3 | 11.2 | 13.6 | 5 | 16.5 | 15.6 | 13.6 | |||
| 2020-05-23 | 144 | Avg | 0-15cm | 0 | 0 | |||||||||
| 2020-05-23 | 144 | Avg | 15-30cm | 0 | 0 | |||||||||
| 2020-05-23 | 144 | Avg | 30-45cm | 0 | 0 | |||||||||
| 2020-05-23 | 144 | Avg | 45-60cm | 0 | 0 |
No TZ grass heigth found
No VR grass heigth found
Tree DBH
| Date | Tag# | Reading (mm) |
|---|---|---|
| 2020-05-23 | 1 | 25.2 |
| 2020-05-23 | 102 | 16.2 |
| 2020-05-23 | 2 | 23.8 |
| 2020-05-23 | 245 | 12.8 |
| 2020-05-23 | 3 | 15.5 |
| 2020-05-23 | 4 | 8.9 |
| 2020-05-23 | 5 | 15.9 |
| 2020-05-23 | 6 | 5.0 |
| 2020-05-23 | 7 | 18.2 |
| 2020-05-23 | 72 | 9.3 |
| 2020-05-23 | 79 | 20.9 |
Water Potential - mode: raw
| Time | Species | Tree | readings (bar) | ||
|---|---|---|---|---|---|
| 2020-05-23 12:52:00 | OAK | 102 | -13 | -7 | -11 |
| 2020-05-23 12:52:00 | OAK | 35 | -10 | -15 | -17 |
| 2020-05-23 12:52:00 | OAK | 92 | -28 | -26 | -20 |
| 2020-05-23 13:21:00 | PINE | OLD | -10 | -24 | -2 |
| 2020-05-23 13:21:00 | PINE | YNG | -0.5 | -0.2 | -2.5 |
No TZ Grass Biomass data found
No TZ OakLeaves Biomass data found
No TZ PineNeedles Biomass data found
1 photos found
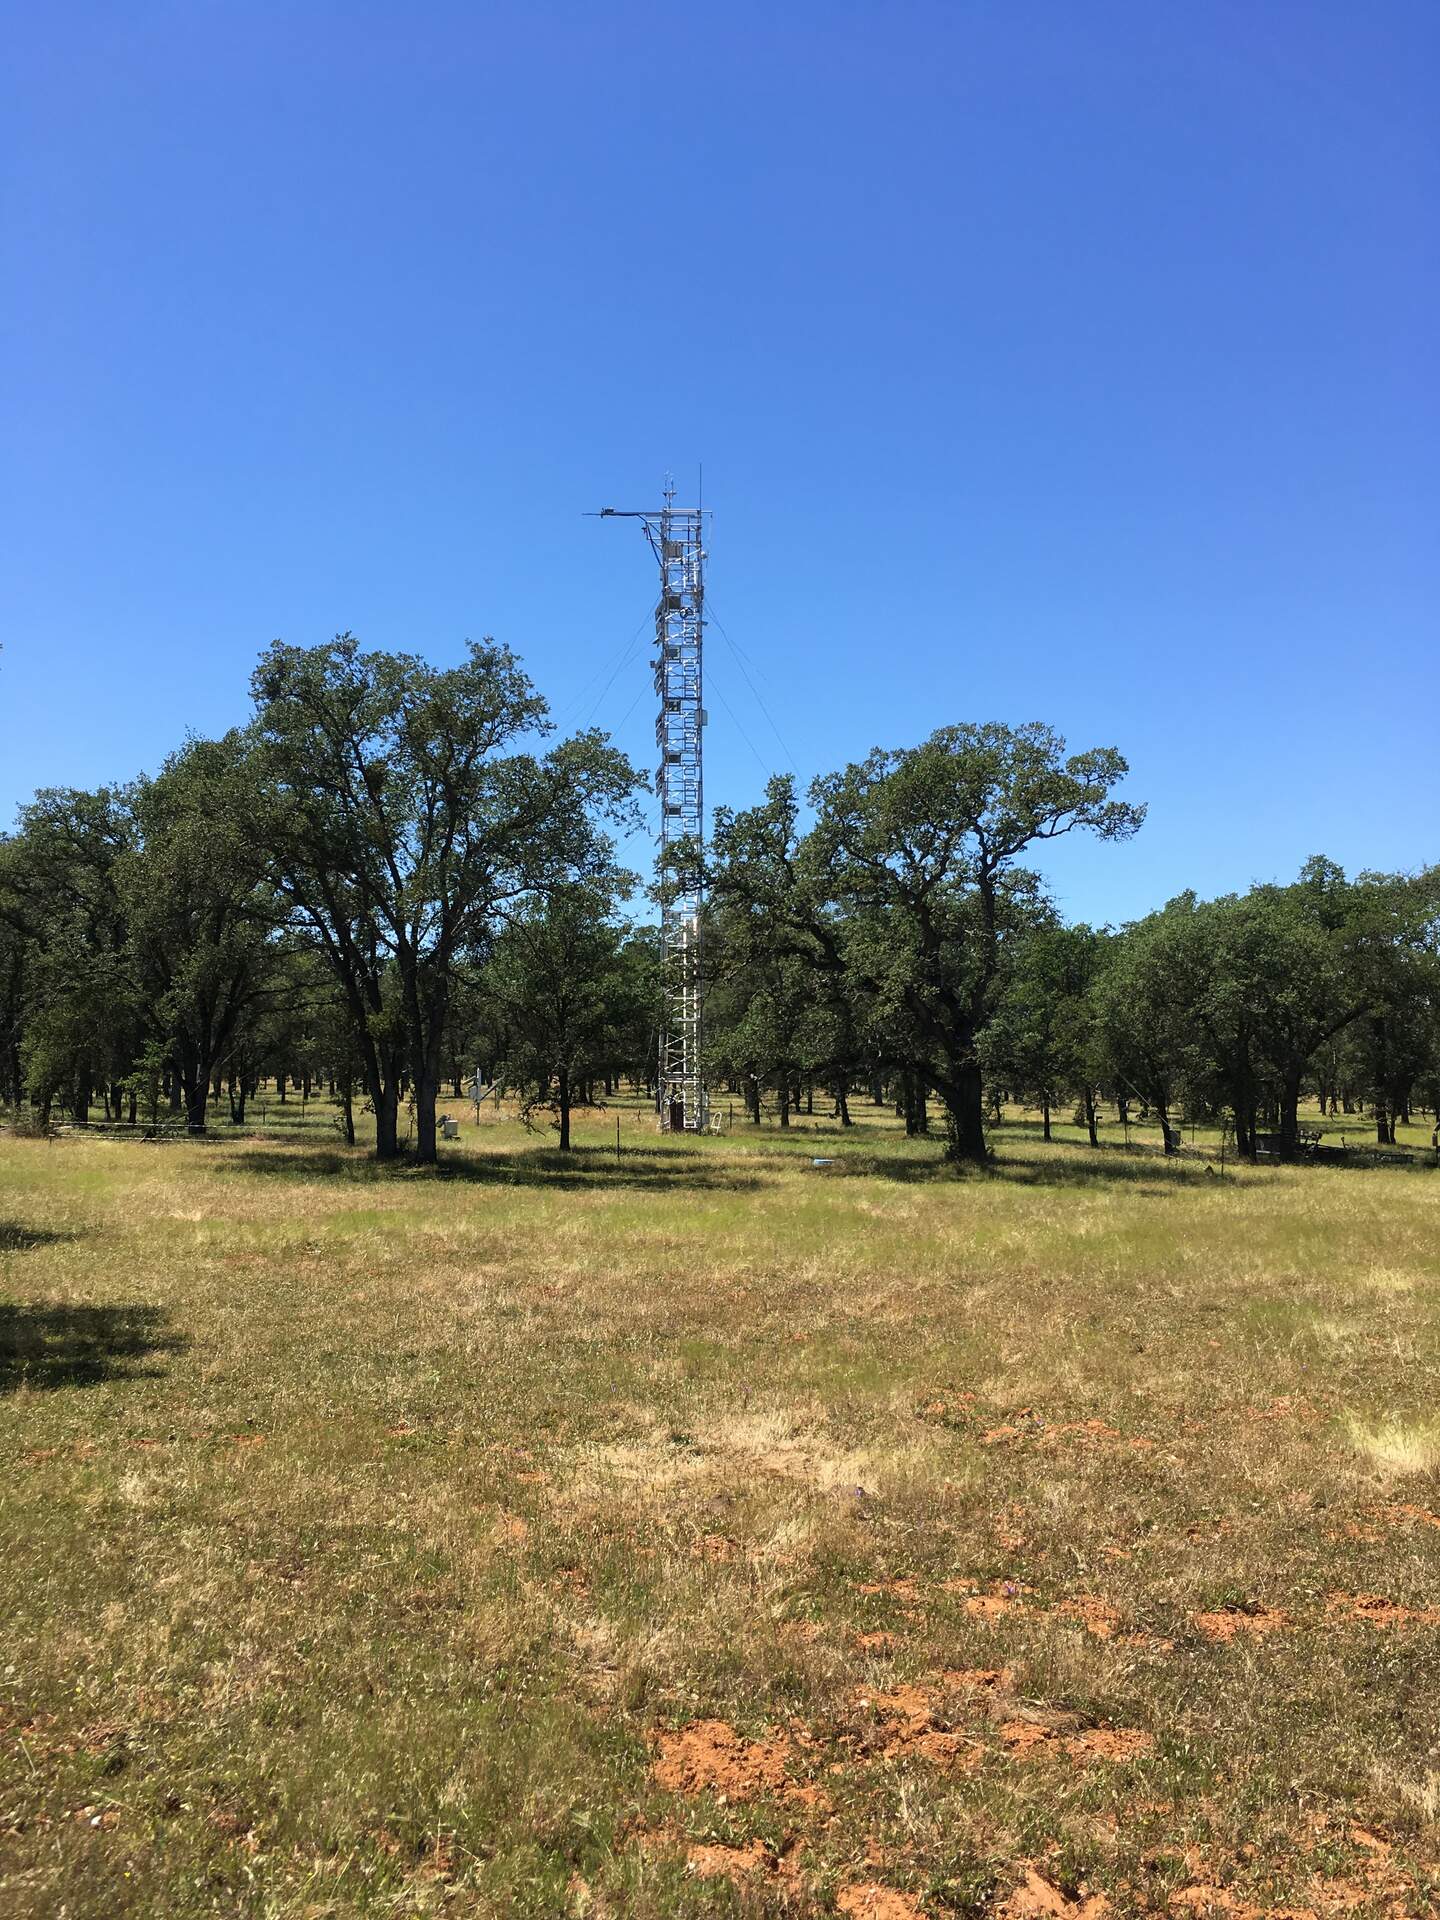
IMG_2577.jpg ( 2020-05-23 13:58:42 ) Full size: 1440x1920
View of the tower from the east
16 sets found
No data found for TZ_Fenergy.
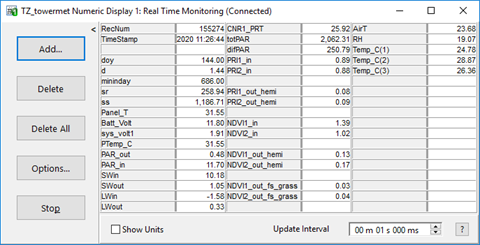
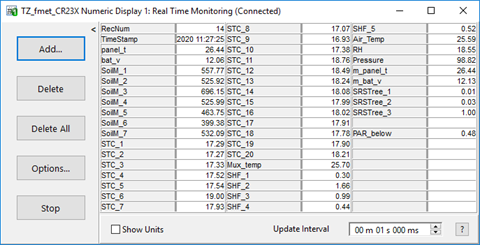
11 TZ_tmet graphs found
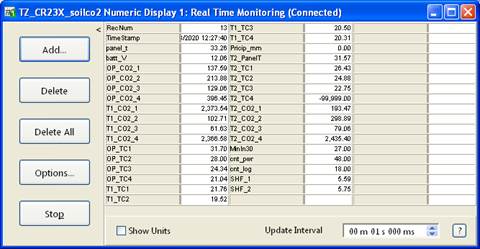
11 TZ_soilco2 graphs found
Can't check TZ_mixed
3 TZ_mixed graphs found
1 TZ_fflux graphs found
8 TZ_fmet graphs found
No data found for TZ_tram.
3 TZ_co2prof graphs found
1 TZ_irt graphs found
No data found for TZ_windprof.
1 TZ_tflux graphs found
2 TZ_sm graphs found
Can't check TZ_met
1 TZ_met graphs found
Can't check TZVR_mixed
8 TZ_osu graphs found
3 TZ_fd graphs found
Tonzi Z-cam data