
Field Notes
<--2020-05-05 10:00:00 | 2020-05-23 10:30:00-->Other sites visited today: Vaira | Tonzi
Phenocam link: Searching...
Tonzi: 2020-05-05 12:15:00 (DOY 126)
Author: Daphne Szutu
Others: Siyan
Summary: Regular data collection/cleaning, trees look good, LattePanda USB not mounting
| 2020-05-05 Tonzi Siyan and I arrived around 12:15 in our separate cars. This is our 8th week of sheltering in place, with at least 3 more weeks to go. It was a warm and sunny day with blue skies and a clear view of the Sierras. The trees are looking full and light green. The grass is greener here than at Vaira, and there were some blooming wildflowers. The pond looked relatively full. I downloaded data: tower Latte Panda, Tower GHG, phenocam, 3 zcams, calibration panel 23x by floor solar panels, Floor GHG, floor well, soil CO2 CR23x, 2 FD chambers by the soil CO2, and the IRT CR1000. I did not clear the FD memory. I also power-cycled the tower met CR1000 to resolve a PRI issue. Siyan downloaded data from the road well and took manual measurements of well levels, soil moisture, and dendrometers. We took veg height measurements. I cleaned the tower and floor radiometers. Siyan swapped the IRT CR1000 battery. The wires are taped to the battery for now—next time we should bring small ends to crimp on. The old battery was soldered on; I brought it back to the lab and placed it downstairs in the small cardboard box next to the battery charger. The voltage was at 13+, so I’m not sure why the IRT datalogger was not sending data to the LattePanda. Through the LattePanda, I checked the CR6 datalogger program that was running the zcam trigger. The program matched what Joe had sent in his e-mail, and the CR6 clock was good. I wanted to copy the program down, but the Cruzer USB stick was not showing up in the LattePanda Windows Explorer. I could see it in the Device Manager, but it had the yellow warning sign with a message similar to “device not started properly.†I tried restarting the LattePanda, using another USB stick, and inserting the USB stick into the LattePanda directly (instead of through the USB extension cable), but none of that worked. Joe said he’s had similar issues before, and maybe there is something wrong with the USB port. I tried restarting CRBasic again to take a picture of the program, but CRBasic was freezing when I tried to open any existing or new program (Connect Screen seemed fine). I then restarted the LattePanda, but the restart froze halfway through. I did a hard restart and things seemed to start ok, so I left it as is. I think the data will still be saved in the individual dataloggers (including the FLIR images?). TF LI-7500 readings: CO2 403ppm H2O 354ppm T 27.5C P 99.5kPa SS 94 --> 100 after cleaning TT LI-7500 readings: CO2 415ppm H2O 344ppm T 24.8C P 99.4kPa SS 100 We left around 15:30. |
Field Data
No tank data
Well Depth
| Date | Location | Depth (feet) |
|---|---|---|
| 2020-05-05 | VR_well | 54.4 |
| 2020-05-05 | TZ_floor | 27.4 |
| 2020-05-05 | TZ_tower | 31.2 |
| 2020-05-05 | TZ_road | 35.9 |
mode = both
Moisture Point Probes TZ
Array
(
[0] => Tower_1
[1] => Floor_South_1
[2] => Floor_West_1
[3] => Soil_Transect_4_1
[4] => Soil_Transect_3_1
[5] => Soil_Transect_2_1
[6] => Soil_Transect_1_1
[7] => SoilCO2_West_A_1
[8] => SoilCO2_West_B_1
[9] => SoilCO2_West_C_1
[10] => Tower_2
[11] => Floor_South_2
[12] => Floor_West_2
[13] => Soil_Transect_4_2
[14] => Soil_Transect_3_2
[15] => Soil_Transect_2_2
[16] => Soil_Transect_1_2
[17] => SoilCO2_West_A_2
[18] => SoilCO2_West_B_2
[19] => SoilCO2_West_C_2
[20] => Tower_3
[21] => Floor_South_3
[22] => Floor_West_3
[23] => Soil_Transect_4_3
[24] => Soil_Transect_3_3
[25] => Soil_Transect_2_3
[26] => Soil_Transect_1_3
[27] => SoilCO2_West_A_3
[28] => SoilCO2_West_B_3
[29] => SoilCO2_West_C_3
[30] => Tower_4
[31] => Floor_South_4
[32] => Floor_West_4
[33] => Soil_Transect_4_4
[34] => Soil_Transect_3_4
[35] => Soil_Transect_2_4
[36] => Soil_Transect_1_4
[37] => SoilCO2_West_A_4
[38] => SoilCO2_West_B_4
[39] => SoilCO2_West_C_4
)
| Date | DOY | Rep | Depth | Tower_1 |
Floor_South_1 |
Floor_West_1 |
Soil_Transect_4_1 |
Soil_Transect_3_1 |
Soil_Transect_2_1 |
Soil_Transect_1_1 |
SoilCO2_West_A_1 |
SoilCO2_West_B_1 |
SoilCO2_West_C_1 |
Tower_2 |
Floor_South_2 |
Floor_West_2 |
Soil_Transect_4_2 |
Soil_Transect_3_2 |
Soil_Transect_2_2 |
Soil_Transect_1_2 |
SoilCO2_West_A_2 |
SoilCO2_West_B_2 |
SoilCO2_West_C_2 |
Tower_3 |
Floor_South_3 |
Floor_West_3 |
Soil_Transect_4_3 |
Soil_Transect_3_3 |
Soil_Transect_2_3 |
Soil_Transect_1_3 |
SoilCO2_West_A_3 |
SoilCO2_West_B_3 |
SoilCO2_West_C_3 |
Tower_4 |
Floor_South_4 |
Floor_West_4 |
Soil_Transect_4_4 |
Soil_Transect_3_4 |
Soil_Transect_2_4 |
Soil_Transect_1_4 |
SoilCO2_West_A_4 |
SoilCO2_West_B_4 |
SoilCO2_West_C_4 |
Avg | Spacial Count |
Measurement Count |
|---|---|---|---|---|---|---|---|---|---|---|---|---|---|---|---|---|---|---|---|---|---|---|---|---|---|---|---|---|---|---|---|---|---|---|---|---|---|---|---|---|---|---|---|---|---|---|
| 2020-05-05 | 126 | 0 | nan | 8.8 | 5.6 | 10.3 | 0.3 | 1.6 | 10 | 5.3 | 16.2 | 10 | 8.8 | 15.8 | 13.1 | 17 | 13.1 | 19.1 | 21 | 7.8 | 14.8 | 6.9 | 18.8 | 21.8 | 24.3 | 21.8 | 16.9 | 21.5 | 25.1 | 22.59 | 24.8 | 23.5 | 25.7 | 33.1 | 25.6 | 36.5 | 20.5 | 37.1 | 41.4 | 21.3 | 39.1 | 39.1 | 41.7 | |||
| 2020-05-05 | 126 | 1 | nan | 9.7 | 5.9 | 10.3 | 2.7 | 1.1 | 11.1 | 5.9 | 16.8 | 10.3 | 9.4 | 15.8 | 12.1 | 16.7 | 11.8 | 18.8 | 20.6 | 7.8 | 13.3 | 6.6 | 19.4 | 21.8 | 24 | 21.8 | 16.8 | 21.8 | 25.1 | 23.2 | 23.7 | 22.9 | 25.7 | 34 | 35.4 | 34.8 | 21.1 | 36.5 | 41.4 | 21.9 | 39.4 | 41.1 | 42.5 | |||
| 2020-05-05 | 126 | Avg | 0-15cm | 0 | 0 | |||||||||||||||||||||||||||||||||||||||||
| 2020-05-05 | 126 | Avg | 15-30cm | 0 | 0 | |||||||||||||||||||||||||||||||||||||||||
| 2020-05-05 | 126 | Avg | 30-45cm | 0 | 0 | |||||||||||||||||||||||||||||||||||||||||
| 2020-05-05 | 126 | Avg | 45-60cm | 0 | 0 |
mode = both
Moisture Point Probes VR
Array
(
[0] => Flux_Tower_1
[1] => Biomass_Cage_1
[2] => Flux_Tower_2
[3] => Biomass_Cage_2
[4] => Flux_Tower_3
[5] => Biomass_Cage_3
[6] => Flux_Tower_4
[7] => Biomass_Cage_4
)
| Date | DOY | Rep | Depth | Flux_Tower_1 |
Biomass_Cage_1 |
Flux_Tower_2 |
Biomass_Cage_2 |
Flux_Tower_3 |
Biomass_Cage_3 |
Flux_Tower_4 |
Biomass_Cage_4 |
Avg | Spacial Count |
Measurement Count |
|---|---|---|---|---|---|---|---|---|---|---|---|---|---|---|
| 2020-05-05 | 126 | 0 | nan | 3.6 | 2.4 | 13.6 | 8.1 | 7 | 7.3 | 18.5 | 18.8 | |||
| 2020-05-05 | 126 | 1 | nan | 3 | 4.3 | 13.9 | 7.8 | 7.3 | 18.2 | 17.9 | 19.9 | |||
| 2020-05-05 | 126 | Avg | 0-15cm | 0 | 0 | |||||||||
| 2020-05-05 | 126 | Avg | 15-30cm | 0 | 0 | |||||||||
| 2020-05-05 | 126 | Avg | 30-45cm | 0 | 0 | |||||||||
| 2020-05-05 | 126 | Avg | 45-60cm | 0 | 0 |
Grass Height TZ 15
| Date | Height reps (cm) | Location | Average | Samp | STDEV | ||||||||||||||
|---|---|---|---|---|---|---|---|---|---|---|---|---|---|---|---|---|---|---|---|
| 2020-05-05 | 14 | 13 | 11 | 7 | 21 | 12 | 24 | 11 | 16 | 11 | 23 | 17 | 10 | 17 | 13 | GH_ALL | 14.67 | 15 | 4.78 |
Grass Height VR 15
| Date | Height reps (cm) | Location | Average | Samp | STDEV | ||||||||||||||
|---|---|---|---|---|---|---|---|---|---|---|---|---|---|---|---|---|---|---|---|
| 2020-05-05 | 40 | 15 | 32 | 40 | 21 | 26 | 22 | 21 | 8 | 16 | 36 | 18 | 36 | 30 | 34 | GH_ALL | 26.33 | 15 | 9.6 |
Tree DBH
| Date | Tag# | Reading (mm) |
|---|---|---|
| 2020-05-05 | 1 | 23.5 |
| 2020-05-05 | 102 | 15.90 |
| 2020-05-05 | 2 | 22.7 |
| 2020-05-05 | 245 | 12.5 |
| 2020-05-05 | 3 | 15.5 |
| 2020-05-05 | 4 | 8.2 |
| 2020-05-05 | 5 | 15.8 |
| 2020-05-05 | 7 | 19.2 |
| 2020-05-05 | 79 | 20.1 |
No water potential data found
No TZ Grass Biomass data found
No TZ OakLeaves Biomass data found
No TZ PineNeedles Biomass data found
1 photos found
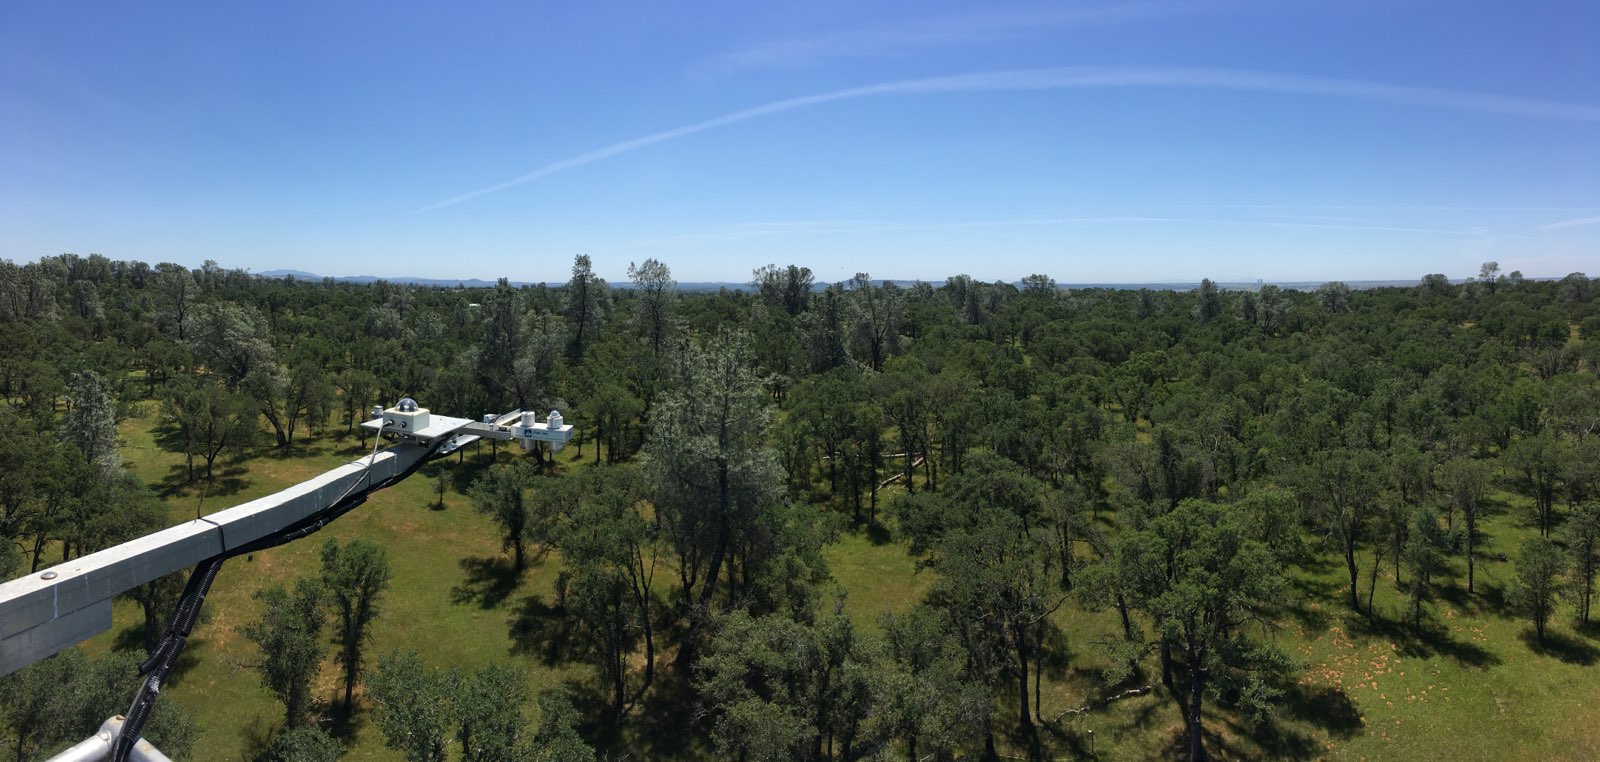
20200505TZ_TowerTop.jpg ( 2020-05-05 00:00:00 ) Full size: 1600x762
View from tower top
16 sets found
No data found for TZ_Fenergy.
11 TZ_tmet graphs found
11 TZ_soilco2 graphs found
Can't check TZ_mixed
3 TZ_mixed graphs found
1 TZ_fflux graphs found
8 TZ_fmet graphs found
No data found for TZ_tram.
3 TZ_co2prof graphs found
1 TZ_irt graphs found
No data found for TZ_windprof.
1 TZ_tflux graphs found
2 TZ_sm graphs found
Can't check TZ_met
1 TZ_met graphs found
Can't check TZVR_mixed
8 TZ_osu graphs found
3 TZ_fd graphs found
Tonzi Z-cam data