
Field Notes
<--2020-03-12 11:15:00 | 2020-04-18 10:00:00-->Other sites visited today: Vaira
Phenocam link: Searching...
Tonzi: 2020-04-01 11:45:00 (DOY 92)
Author: Joe Verfaillie
Others: Kyoko, Hisashi
Summary: Fieldwork with help from my family, pond is only half full, tree slowly putting on leaves, troubleshooting COSMOS - maybe working again, power outage at soil co2 - fixed
| Tonzi 2020-04-01 Kyoko, Hisashi and I arrived at about 11:45. It was partly cloudy, cool in the shadows and warm in the sun. There has been some rain and there are puddles in the road, but the pond is still only half full. The trees are still putting on leaves slowly – some tree are almost fully leafed out and others barely have any. We met Rob on the way out mending fences. He said his land is 680acres. He also said folks in the area are still struggling with wild pigs. He killed one that was about 170 pounds but not too good to eat – too tough. He asked if I knew anyone that had COVID-19. At this time, I don’t. I collected the data, serviced and z-cams, and read the dendrometers. Hisashi and Kyoko did the soil moisture and the well measurements. The Tower read: 404.9ppm CO2, 327.3mmol/m3 H2O, 98.9kPa, 14.6C, 101.1SS The Floor read: 420.4ppm CO2, 447.7mmol/m3 H2O, 99.0kPa, 16.7C, 102.8SS The power was out at the soil CO2 system. I stepped on some wires last time out and apparently pulled the ground wire from the batteries loose from the solar controller. This system needs a complete overhaul. I restored the power, but no soil CO2 data or FD Chamber data for the last three weeks. The lithium power pack at the road well was down to three of five power lights and the Global Water sensor was reporting 10.6V. I swapped the power pack out with one of our new larger packs. The sensor was reading about 0.5ft of water. The COSMOS system has not been reporting data since Dennis and I messed with it back on June 13th. I checked on it and didn’t see anything wrong. There were about 2000 files on its SD card but all small so plenty of space left. I copied the files off for later, put the card back and restarted the system. Just before leaving I talk to a technician (Gary Womack ) who said he saw a couple of messages from the system. So maybe it’s working again. I realigned the IRTs pointed at the tree trunk slightly. The IRT system at the little tree hasn’t connected for about 10 days but I didn’t notice this until I was back in the lab. It doesn’t look like a power problem so probably the data is okay on the CR1000. We left about 14:45 |
Field Data
No tank data
Well Depth
| Date | Location | Depth (feet) |
|---|---|---|
| 2020-04-01 | VR_well | 56.1 |
| 2020-04-01 | TZ_road | 37.6 |
| 2020-04-01 | TZ_floor | 29.2 |
| 2020-04-01 | TZ_tower | 33.7 |
mode = both
Moisture Point Probes TZ
Array
(
[0] => Tower_1
[1] => Floor_South_1
[2] => Floor_West_1
[3] => Soil_Transect_4_1
[4] => Soil_Transect_3_1
[5] => Soil_Transect_2_1
[6] => Soil_Transect_1_1
[7] => SoilCO2_West_A_1
[8] => SoilCO2_West_B_1
[9] => SoilCO2_West_C_1
[10] => Tower_2
[11] => Floor_South_2
[12] => Floor_West_2
[13] => Soil_Transect_4_2
[14] => Soil_Transect_3_2
[15] => Soil_Transect_2_2
[16] => Soil_Transect_1_2
[17] => SoilCO2_West_A_2
[18] => SoilCO2_West_B_2
[19] => SoilCO2_West_C_2
[20] => Tower_3
[21] => Floor_South_3
[22] => Floor_West_3
[23] => Soil_Transect_4_3
[24] => Soil_Transect_3_3
[25] => Soil_Transect_2_3
[26] => Soil_Transect_1_3
[27] => SoilCO2_West_A_3
[28] => SoilCO2_West_B_3
[29] => SoilCO2_West_C_3
[30] => Tower_4
[31] => Floor_South_4
[32] => Floor_West_4
[33] => Soil_Transect_4_4
[34] => Soil_Transect_3_4
[35] => Soil_Transect_2_4
[36] => Soil_Transect_1_4
[37] => SoilCO2_West_A_4
[38] => SoilCO2_West_B_4
[39] => SoilCO2_West_C_4
)
| Date | DOY | Rep | Depth | Tower_1 |
Floor_South_1 |
Floor_West_1 |
Soil_Transect_4_1 |
Soil_Transect_3_1 |
Soil_Transect_2_1 |
Soil_Transect_1_1 |
SoilCO2_West_A_1 |
SoilCO2_West_B_1 |
SoilCO2_West_C_1 |
Tower_2 |
Floor_South_2 |
Floor_West_2 |
Soil_Transect_4_2 |
Soil_Transect_3_2 |
Soil_Transect_2_2 |
Soil_Transect_1_2 |
SoilCO2_West_A_2 |
SoilCO2_West_B_2 |
SoilCO2_West_C_2 |
Tower_3 |
Floor_South_3 |
Floor_West_3 |
Soil_Transect_4_3 |
Soil_Transect_3_3 |
Soil_Transect_2_3 |
Soil_Transect_1_3 |
SoilCO2_West_A_3 |
SoilCO2_West_B_3 |
SoilCO2_West_C_3 |
Tower_4 |
Floor_South_4 |
Floor_West_4 |
Soil_Transect_4_4 |
Soil_Transect_3_4 |
Soil_Transect_2_4 |
Soil_Transect_1_4 |
SoilCO2_West_A_4 |
SoilCO2_West_B_4 |
SoilCO2_West_C_4 |
Avg | Spacial Count |
Measurement Count |
|---|---|---|---|---|---|---|---|---|---|---|---|---|---|---|---|---|---|---|---|---|---|---|---|---|---|---|---|---|---|---|---|---|---|---|---|---|---|---|---|---|---|---|---|---|---|---|
| 2020-04-01 | 92 | 0 | nan | 32 | 20.3 | 25.8 | 20 | 21.2 | 25.6 | 22 | 32.5 | 30.5 | 26.1 | 31.6 | 34.4 | 32.6 | 28 | 32.3 | 31.6 | 19.4 | 27.4 | 20.3 | 31 | 32.4 | 39.9 | 36 | 30.1 | 32.4 | 34.1 | 32.4 | 35.4 | 34.9 | 37.7 | 40.8 | 48.6 | 42.3 | 33.7 | 43.4 | 48.8 | 33.4 | 44.5 | 49.7 | 48.3 | |||
| 2020-04-01 | 92 | 1 | nan | 20.6 | 25.8 | 20.3 | 15.9 | 24.7 | 21.4 | 33.2 | 32.9 | 25.6 | 34.4 | 32.3 | 28.3 | 31 | 31.3 | 19.7 | 26.8 | 19.4 | 30.1 | 39.6 | 40.2 | 35.7 | 31.3 | 32.4 | 34.9 | 32.7 | 35.4 | 34.9 | 37.4 | 41.1 | 48 | 42 | 34.5 | 43.4 | 48.3 | 33.4 | 44.8 | 49.4 | 46.6 | |||||
| 2020-04-01 | 92 | Avg | 0-15cm | 0 | 0 | |||||||||||||||||||||||||||||||||||||||||
| 2020-04-01 | 92 | Avg | 15-30cm | 0 | 0 | |||||||||||||||||||||||||||||||||||||||||
| 2020-04-01 | 92 | Avg | 30-45cm | 0 | 0 | |||||||||||||||||||||||||||||||||||||||||
| 2020-04-01 | 92 | Avg | 45-60cm | 0 | 0 |
mode = both
Moisture Point Probes VR
Array
(
[0] => Flux_Tower_1
[1] => Flux_Tower_2
[2] => Biomass_Cage_2
[3] => Flux_Tower_3
[4] => Biomass_Cage_3
[5] => Flux_Tower_4
[6] => Biomass_Cage_4
[7] => Biomass_Cage_1
)
| Date | DOY | Rep | Depth | Flux_Tower_1 |
Flux_Tower_2 |
Biomass_Cage_2 |
Flux_Tower_3 |
Biomass_Cage_3 |
Flux_Tower_4 |
Biomass_Cage_4 |
Biomass_Cage_1 |
Avg | Spacial Count |
Measurement Count |
|---|---|---|---|---|---|---|---|---|---|---|---|---|---|---|
| 2020-04-01 | 92 | 0 | nan | 15.9 | 30.4 | 19.1 | 16.5 | 34.3 | 27.9 | 31.9 | ||||
| 2020-04-01 | 92 | 1 | nan | 15.3 | 30.1 | 17.6 | 16.2 | 32.1 | 28.5 | 30.5 | 16.5 | |||
| 2020-04-01 | 92 | Avg | 0-15cm | 0 | 0 | |||||||||
| 2020-04-01 | 92 | Avg | 15-30cm | 0 | 0 | |||||||||
| 2020-04-01 | 92 | Avg | 30-45cm | 0 | 0 | |||||||||
| 2020-04-01 | 92 | Avg | 45-60cm | 0 | 0 |
No TZ grass heigth found
Grass Height VR 10
| Date | Height reps (cm) | Location | Average | Samp | STDEV | |||||||||
|---|---|---|---|---|---|---|---|---|---|---|---|---|---|---|
| 2020-04-01 | 21 | 10 | 9 | 12 | 10 | 18 | 12 | 11 | 8 | 9 | GH_ALL | 12 | 10 | 4 |
Tree DBH
| Date | Tag# | Reading (mm) |
|---|---|---|
| 2020-04-01 | 1 | 22.7 |
| 2020-04-01 | 102 | 15.2 |
| 2020-04-01 | 2 | 22.2 |
| 2020-04-01 | 245 | 12.3 |
| 2020-04-01 | 3 | 14.8 |
| 2020-04-01 | 4 | 7.7 |
| 2020-04-01 | 6 | 15.4 |
| 2020-04-01 | 7 | 19.0 |
| 2020-04-01 | 72 | 6.5 |
| 2020-04-01 | 79 | 19.8 |
| 2020-04-01 | 8 | 1.8 |
No water potential data found
No TZ Grass Biomass data found
No TZ OakLeaves Biomass data found
No TZ PineNeedles Biomass data found
2 photos found
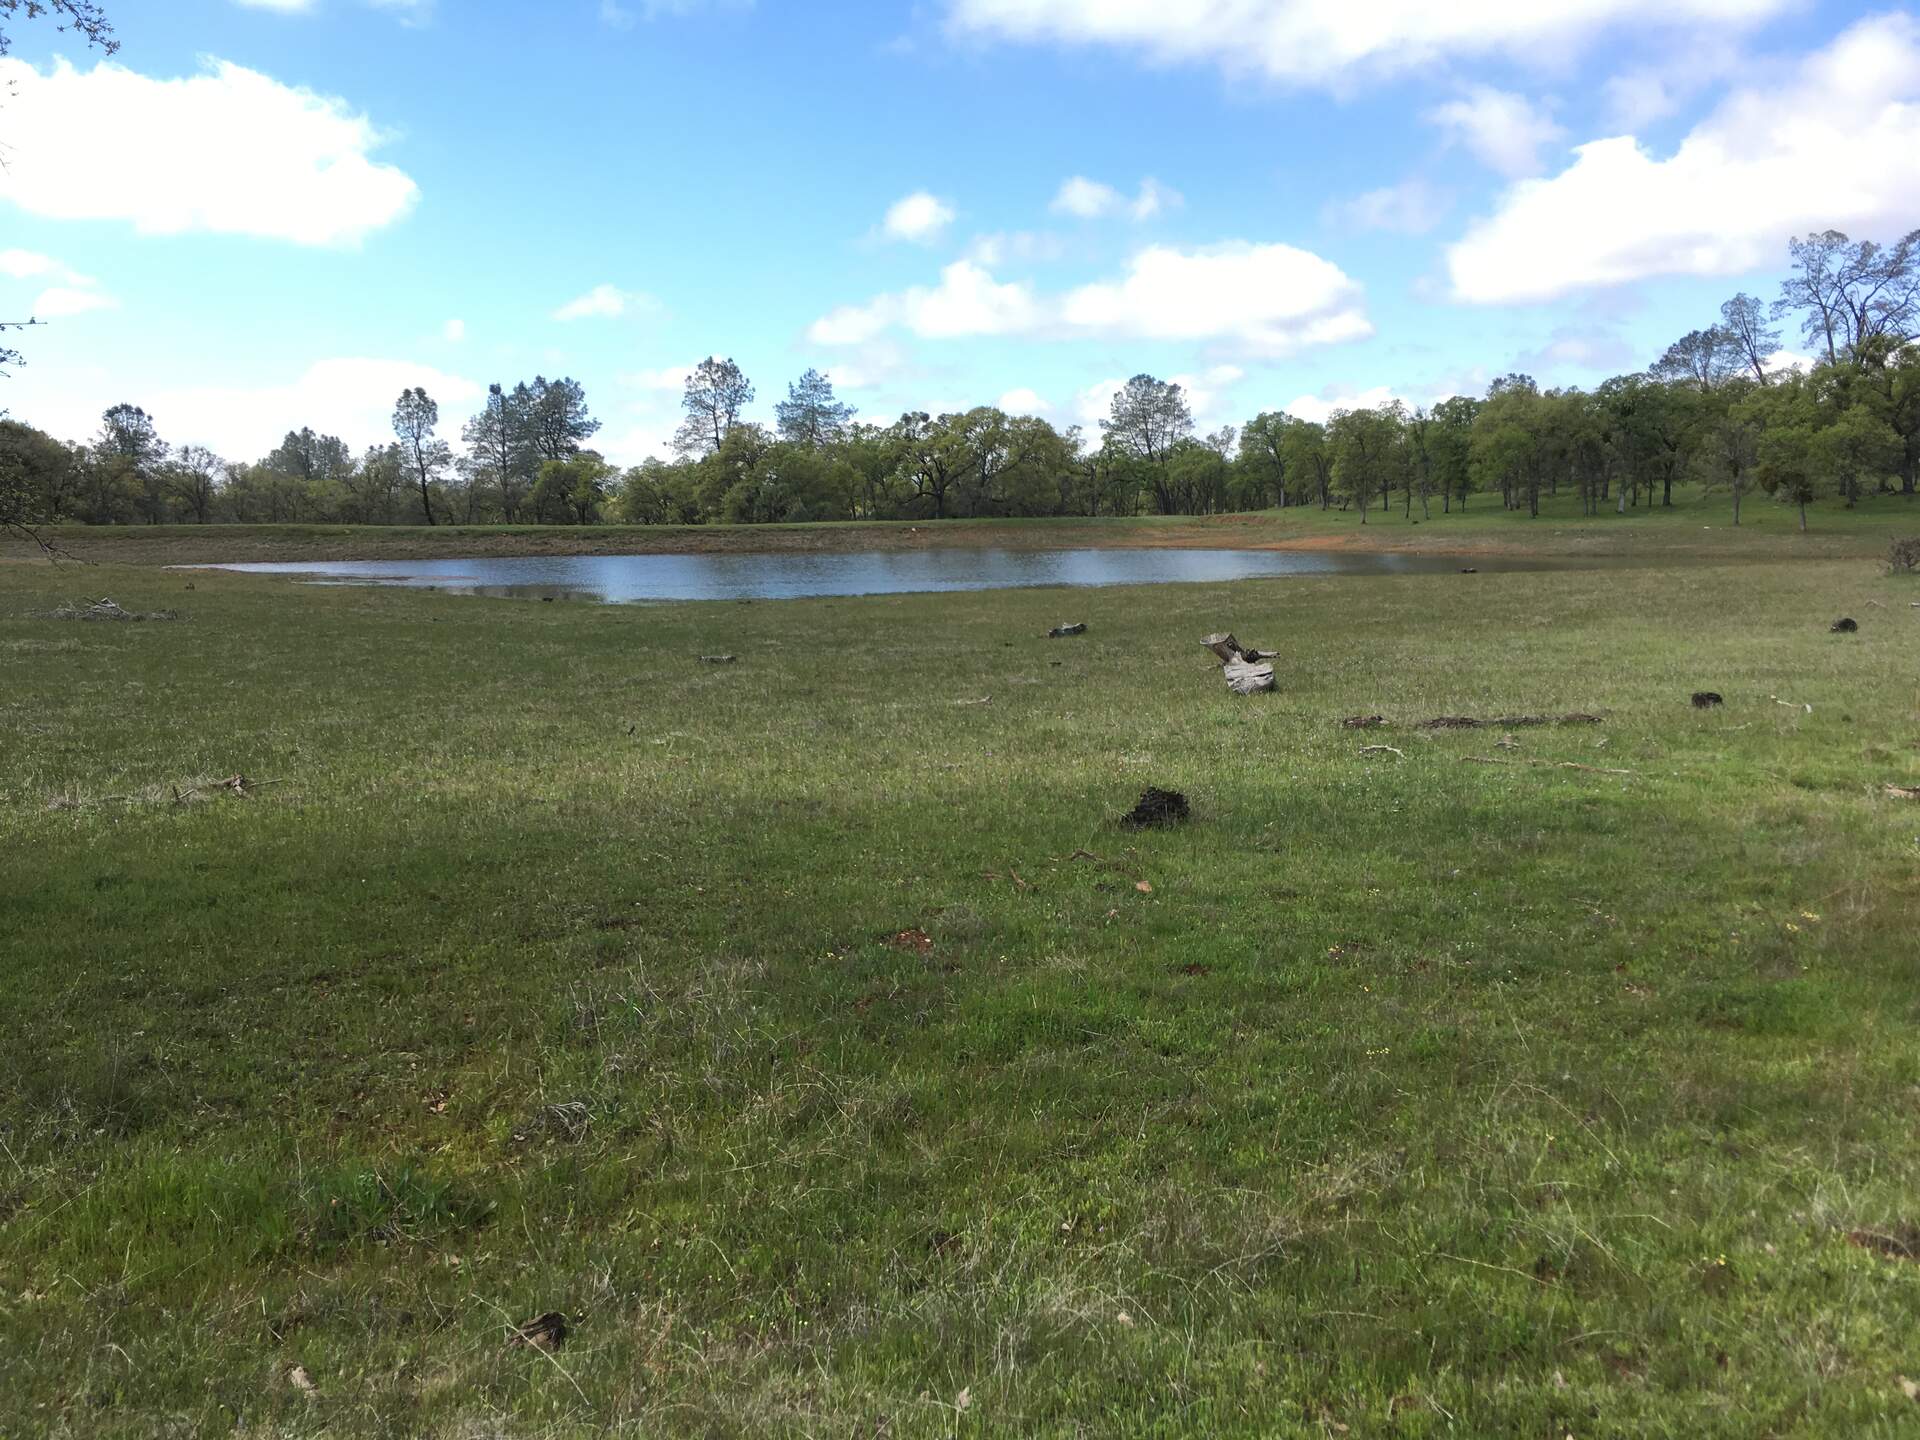
20200401TZ_Pond.jpg ( 2020-04-01 00:00:00 ) Full size: 1920x1440
The Tonzi pond is still only about half full
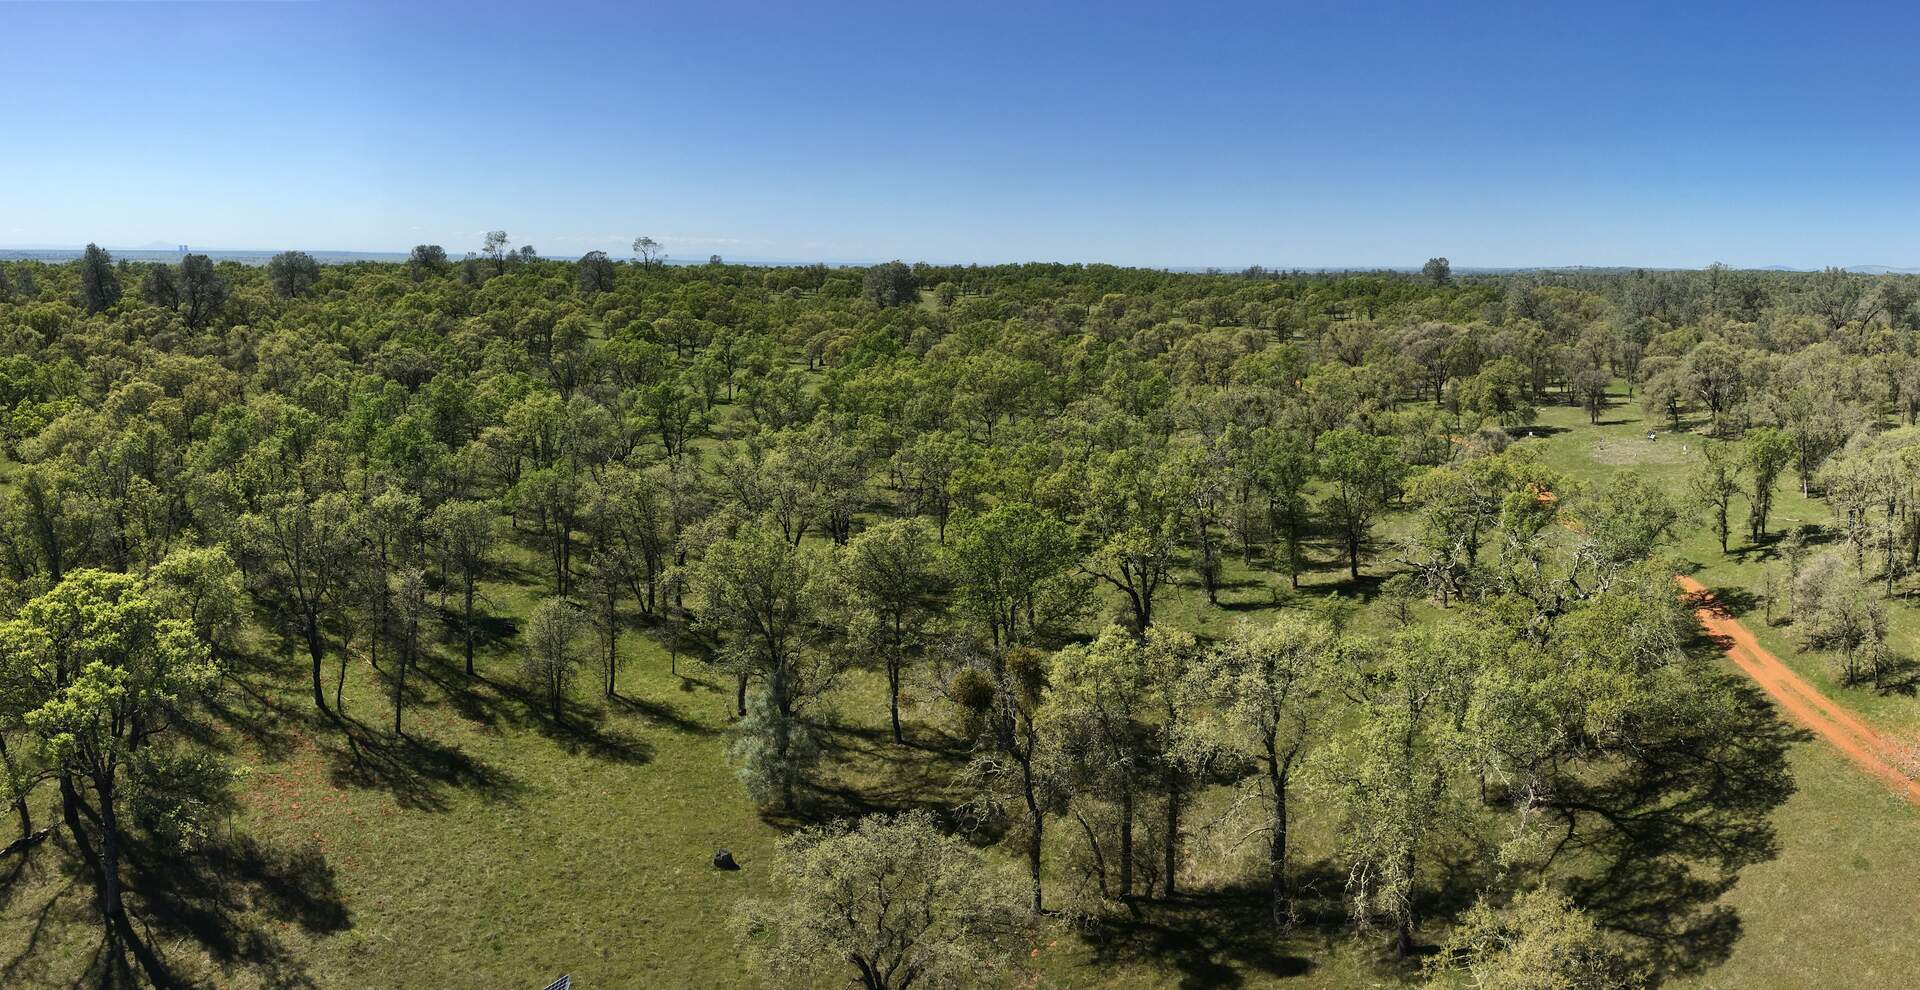
20200401TZ_SpringGreen.jpg ( 2020-04-01 00:00:00 ) Full size: 1920x990
View to the west from the Tower
16 sets found
No data found for TZ_Fenergy.
11 TZ_tmet graphs found
No data found for TZ_soilco2.
Can't check TZ_mixed
3 TZ_mixed graphs found
1 TZ_fflux graphs found
8 TZ_fmet graphs found
No data found for TZ_tram.
3 TZ_co2prof graphs found
1 TZ_irt graphs found
No data found for TZ_windprof.
1 TZ_tflux graphs found
2 TZ_sm graphs found
Can't check TZ_met
1 TZ_met graphs found
Can't check TZVR_mixed
8 TZ_osu graphs found
No data found for TZ_fd.
Tonzi Z-cam data