
Field Notes
<--2020-03-02 09:45:00 | 2020-04-01 11:45:00-->Other sites visited today: Vaira
Phenocam link: Searching...
Tonzi: 2020-03-12 11:15:00 (DOY 72)
Author: Joe Verfaillie
Others: Daphne
Summary: Fixed co2prof vs irt file name conflict, measured equipment locations, cows around, repaired cow fence at soil co2
| Tonzi 2020-03-12 Daphne and I arrived at about 11:15. It was clear sunny and warm. We got a little rain last week but things still look dry here. The trees have started to put on leaves. About half the trees have new leaves but it is kind of patchy with the trees directly northwest of the tower mostly still bare. I collect data at the Tower. Loggernet had written about 900 one-line files containing data from the Vaisala co2 profile and the original IRT system. I saw this starting to happen before I left last time but couldn’t figure out why. Apparently I somehow name both data files the same. Loggernet was smart enough to figure out that the data was different and started a new file each time it collected data. Otherwise things seemed fine. Daphne helped me make a bunch of equipment location measurements around the tower. The 7500s read: Tower: 429.8ppm CO2, 457.0mmol/m3 H2O, 98.6kPa, 17.0C, 102.6SS Floor: 432.4ppm CO2, 499.2mmol/m3 H2O, 98.6kPan 20.6C, 99.3SS I collected the rest of the data from the data loggers including the FD chambers. The lithium power pack at the Road Well still seemed okay - it was slightly below 12V but only one charge status light had gone out. I left it in place especially since the water level is still below the sensor. Daphne did the Moisture point, wells, DBH, and serviced the z-cams. We repaired the cow fence around the soil co2 system. There were cows hanging out at the water container when we arrived. We left about 14:30 |
Field Data
No tank data
Well Depth
| Date | Location | Depth (feet) |
|---|---|---|
| 2020-03-12 | VR_well | 57.43 |
| 2020-03-12 | TZ_floor | 30.11 |
| 2020-03-12 | TZ_tower | 34.78 |
| 2020-03-12 | TZ_road | 38.14 |
mode = both
Moisture Point Probes TZ
Array
(
[0] => Tower_1
[1] => Floor_South_1
[2] => Floor_West_1
[3] => Soil_Transect_4_1
[4] => Soil_Transect_3_1
[5] => Soil_Transect_2_1
[6] => Soil_Transect_1_1
[7] => SoilCO2_West_A_1
[8] => SoilCO2_West_B_1
[9] => SoilCO2_West_C_1
[10] => Tower_2
[11] => Floor_South_2
[12] => Floor_West_2
[13] => Soil_Transect_4_2
[14] => Soil_Transect_3_2
[15] => Soil_Transect_2_2
[16] => Soil_Transect_1_2
[17] => SoilCO2_West_A_2
[18] => SoilCO2_West_B_2
[19] => SoilCO2_West_C_2
[20] => Tower_3
[21] => Floor_South_3
[22] => Floor_West_3
[23] => Soil_Transect_4_3
[24] => Soil_Transect_3_3
[25] => Soil_Transect_2_3
[26] => Soil_Transect_1_3
[27] => SoilCO2_West_A_3
[28] => SoilCO2_West_B_3
[29] => SoilCO2_West_C_3
[30] => Tower_4
[31] => Floor_South_4
[32] => Floor_West_4
[33] => Soil_Transect_4_4
[34] => Soil_Transect_3_4
[35] => Soil_Transect_2_4
[36] => Soil_Transect_1_4
[37] => SoilCO2_West_A_4
[38] => SoilCO2_West_B_4
[39] => SoilCO2_West_C_4
)
| Date | DOY | Rep | Depth | Tower_1 |
Floor_South_1 |
Floor_West_1 |
Soil_Transect_4_1 |
Soil_Transect_3_1 |
Soil_Transect_2_1 |
Soil_Transect_1_1 |
SoilCO2_West_A_1 |
SoilCO2_West_B_1 |
SoilCO2_West_C_1 |
Tower_2 |
Floor_South_2 |
Floor_West_2 |
Soil_Transect_4_2 |
Soil_Transect_3_2 |
Soil_Transect_2_2 |
Soil_Transect_1_2 |
SoilCO2_West_A_2 |
SoilCO2_West_B_2 |
SoilCO2_West_C_2 |
Tower_3 |
Floor_South_3 |
Floor_West_3 |
Soil_Transect_4_3 |
Soil_Transect_3_3 |
Soil_Transect_2_3 |
Soil_Transect_1_3 |
SoilCO2_West_A_3 |
SoilCO2_West_B_3 |
SoilCO2_West_C_3 |
Tower_4 |
Floor_South_4 |
Floor_West_4 |
Soil_Transect_4_4 |
Soil_Transect_3_4 |
Soil_Transect_2_4 |
Soil_Transect_1_4 |
SoilCO2_West_A_4 |
SoilCO2_West_B_4 |
SoilCO2_West_C_4 |
Avg | Spacial Count |
Measurement Count |
|---|---|---|---|---|---|---|---|---|---|---|---|---|---|---|---|---|---|---|---|---|---|---|---|---|---|---|---|---|---|---|---|---|---|---|---|---|---|---|---|---|---|---|---|---|---|---|
| 2020-03-12 | 72 | 0 | nan | 15 | 9.4 | 17.1 | 8.8 | 11.5 | 12.1 | 9.7 | 21.7 | 15.3 | 10 | 18.8 | 13 | 21.3 | 13.6 | 24.6 | 25.2 | 10.9 | 19.4 | 10.9 | 19.1 | 23.2 | 24.3 | 39.6 | 17.6 | 25.4 | 29.6 | 26.8 | 28.5 | 26.8 | 27.9 | 34 | 17.6 | 41.4 | 21.1 | 36.5 | 41.7 | 23.9 | 40.3 | 43.4 | 42.5 | |||
| 2020-03-12 | 72 | 1 | nan | 15.6 | 9.1 | 16.2 | 8.6 | 11.8 | 12.4 | 9.1 | 21.4 | 15.3 | 9.7 | 19.4 | 13.3 | 21 | 13.3 | 24.6 | 24.9 | 12.1 | 20 | 9.3 | 19.1 | 22.6 | 25.4 | 39.6 | 17.6 | 25.1 | 28.8 | 27.1 | 28.2 | 27.1 | 27.6 | 33.4 | 17.3 | 41.4 | 21.3 | 36.5 | 41.4 | 24.5 | 40 | 44.3 | 42.3 | |||
| 2020-03-12 | 72 | 2 | nan | 13.5 | 21.7 | 39.6 | 41.4 | |||||||||||||||||||||||||||||||||||||||
| 2020-03-12 | 72 | Avg | 0-15cm | 0 | 0 | |||||||||||||||||||||||||||||||||||||||||
| 2020-03-12 | 72 | Avg | 15-30cm | 0 | 0 | |||||||||||||||||||||||||||||||||||||||||
| 2020-03-12 | 72 | Avg | 30-45cm | 0 | 0 | |||||||||||||||||||||||||||||||||||||||||
| 2020-03-12 | 72 | Avg | 45-60cm | 0 | 0 |
mode = both
Moisture Point Probes VR
Array
(
[0] => Flux_Tower_1
[1] => Biomass_Cage_1
[2] => Flux_Tower_2
[3] => Biomass_Cage_2
[4] => Flux_Tower_3
[5] => Biomass_Cage_3
[6] => Solar_Panels_4
[7] => Flux_Tower_4
[8] => Biomass_Cage_4
)
| Date | DOY | Rep | Depth | Flux_Tower_1 |
Biomass_Cage_1 |
Flux_Tower_2 |
Biomass_Cage_2 |
Flux_Tower_3 |
Biomass_Cage_3 |
Solar_Panels_4 |
Flux_Tower_4 |
Biomass_Cage_4 |
Avg | Spacial Count |
Measurement Count |
|---|---|---|---|---|---|---|---|---|---|---|---|---|---|---|---|
| 2020-03-12 | 72 | 0 | nan | 7.7 | 3.9 | 19.1 | 10.6 | 10.1 | 19.5 | 31.1 | 20.8 | 20.5 | |||
| 2020-03-12 | 72 | 1 | nan | 8 | 4.2 | 19.7 | 11.2 | 10.3 | 20.1 | 31.9 | 20.8 | 21.3 | |||
| 2020-03-12 | 72 | 2 | nan | 3.6 | 11.2 | 20.7 | 21.1 | ||||||||
| 2020-03-12 | 72 | Avg | 0-15cm | 0 | 0 | ||||||||||
| 2020-03-12 | 72 | Avg | 15-30cm | 0 | 0 | ||||||||||
| 2020-03-12 | 72 | Avg | 30-45cm | 0 | 0 | ||||||||||
| 2020-03-12 | 72 | Avg | 45-60cm | 0 | 0 |
No TZ grass heigth found
No VR grass heigth found
Tree DBH
| Date | Tag# | Reading (mm) |
|---|---|---|
| 2020-03-12 | 1 | 21.3 |
| 2020-03-12 | 102 | 12.3 |
| 2020-03-12 | 2 | 21.0 |
| 2020-03-12 | 3 | 13.9 |
| 2020-03-12 | 4 | 6.4 |
| 2020-03-12 | 6 | 15.2 |
| 2020-03-12 | 7 | 18.7 |
| 2020-03-12 | 72 | 5.0 |
| 2020-03-12 | 79 | 19.0 |
| 2020-03-12 | 8 | 2.2 |
No water potential data found
No TZ Grass Biomass data found
No TZ OakLeaves Biomass data found
No TZ PineNeedles Biomass data found
2 photos found

20200312TZ_TreesLeaves.jpg ( 2020-03-12 00:00:00 ) Full size: 1440x1920
Trees are putting on leaves
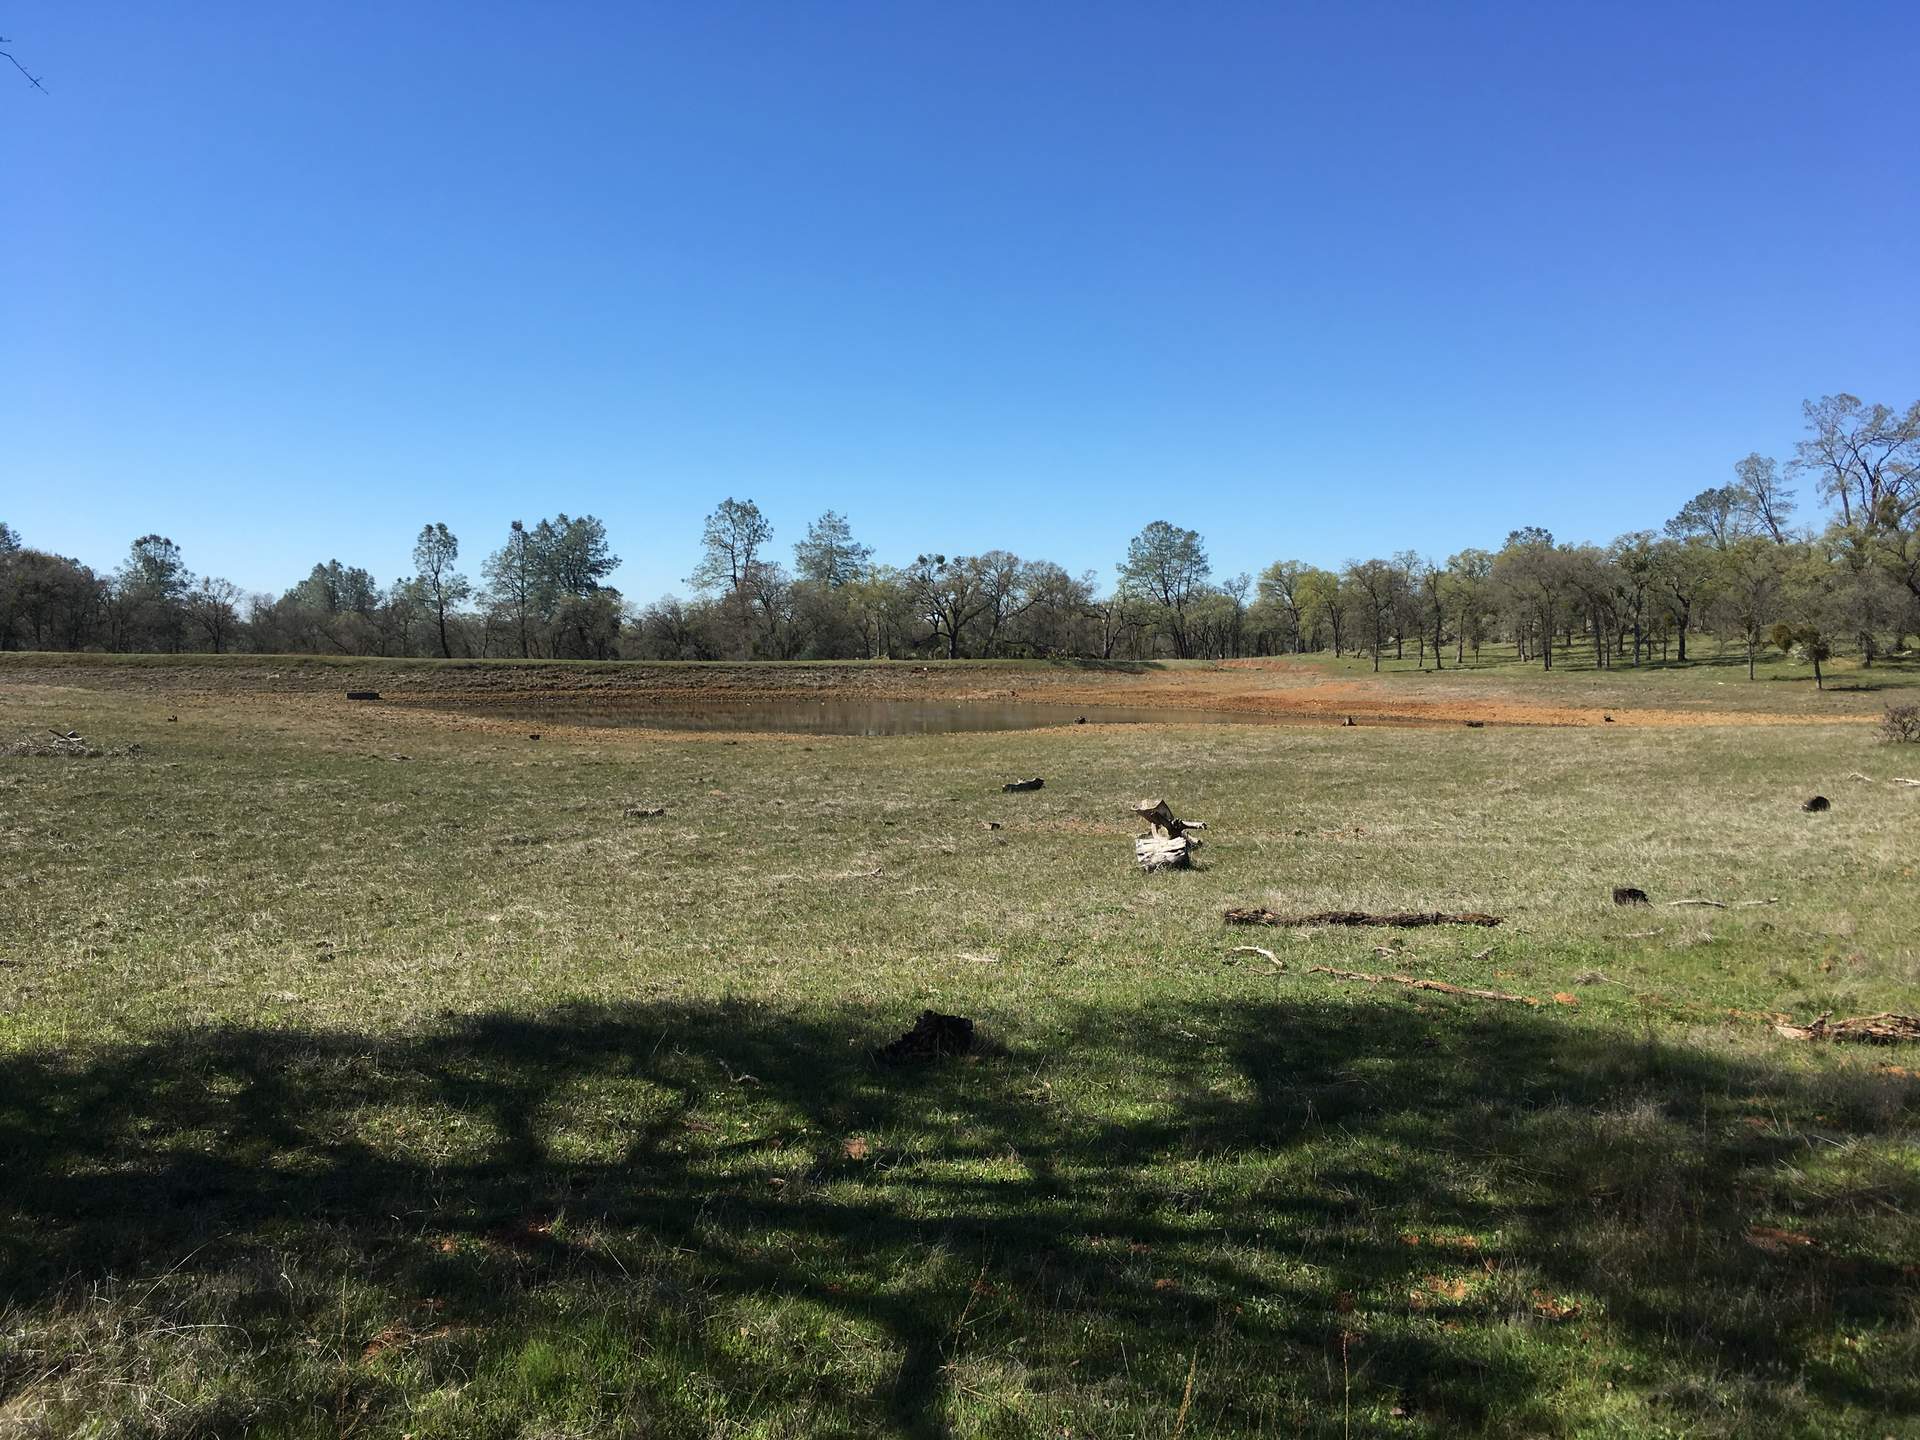
20200312TZ_Pond.jpg ( 2020-03-12 00:00:00 ) Full size: 1920x1440
Regular photo of the pond
16 sets found
No data found for TZ_Fenergy.
11 TZ_tmet graphs found
11 TZ_soilco2 graphs found
Can't check TZ_mixed
3 TZ_mixed graphs found
1 TZ_fflux graphs found
8 TZ_fmet graphs found
No data found for TZ_tram.
3 TZ_co2prof graphs found
1 TZ_irt graphs found
No data found for TZ_windprof.
1 TZ_tflux graphs found
2 TZ_sm graphs found
Can't check TZ_met
1 TZ_met graphs found
Can't check TZVR_mixed
8 TZ_osu graphs found
3 TZ_fd graphs found
Tonzi Z-cam data