
Field Notes
<--2020-03-12 10:00:00 | 2020-04-18 13:00:00-->Other sites visited today: Tonzi
Phenocam link: Searching...
Vaira: 2020-04-01 10:15:00 (DOY 92)
Author: Joe Verfaillie
Others: Hisashi, Kyoko
Summary: Fieldwork with help from the family, wetter but not wet, trees slowly putting on leaves, pond still not full, condensation in BF3
| Vaira 2020-04-01 Hisashi, Kyoko and I arrived at 10:15. It was partly cloudy, warm in the sun cool in the shade. The trees are still slowly putting on leave. There has been a bit more rain but the road is largely dry with just some small puddles. The waterhole is full but the pond level was only 19.58ft still not full. The grass and especially the broadleaves are getting taller. All seemed surprisingly normal when the rest of the world is anything but normal – third week of COVID-19 lock down in the Bay Area. I collected the data and did spectral measurements. Kyoko and Hisashi did soil moisture, veg height and took clip plots. The 7500 read: 415.8ppm CO2, 386.7mmol/m3 H2O, 99.6kPa, 13.0C, 99.5SS I replaced the cable to the FD chamber with a longer one removing the ugly splice we left wrapped in the plastic bag last time. I collected the FD data. There was some grass sprouting inside the FD Chamber collar. I moved the FD unit, pulled the grass and put it back. There was condensation inside the BF3 – bring some desiccant packs next time. The well level was 56.1ft The solar controller box door was open but everything inside looked okay – I closed it. |
Veg Height (cm): Tape measure from ground to top of plant
21, 10, 9, 12, 10, 18, 12, 11, 8, 9, avg = 12, stdev = 4.22
Field Data
No tank data
Well Depth
| Date | Location | Depth (feet) |
|---|---|---|
| 2020-04-01 | VR_well | 56.1 |
| 2020-04-01 | TZ_road | 37.6 |
| 2020-04-01 | TZ_floor | 29.2 |
| 2020-04-01 | TZ_tower | 33.7 |
mode = both
Moisture Point Probes TZ
Array
(
[0] => Tower_1
[1] => Floor_South_1
[2] => Floor_West_1
[3] => Soil_Transect_4_1
[4] => Soil_Transect_3_1
[5] => Soil_Transect_2_1
[6] => Soil_Transect_1_1
[7] => SoilCO2_West_A_1
[8] => SoilCO2_West_B_1
[9] => SoilCO2_West_C_1
[10] => Tower_2
[11] => Floor_South_2
[12] => Floor_West_2
[13] => Soil_Transect_4_2
[14] => Soil_Transect_3_2
[15] => Soil_Transect_2_2
[16] => Soil_Transect_1_2
[17] => SoilCO2_West_A_2
[18] => SoilCO2_West_B_2
[19] => SoilCO2_West_C_2
[20] => Tower_3
[21] => Floor_South_3
[22] => Floor_West_3
[23] => Soil_Transect_4_3
[24] => Soil_Transect_3_3
[25] => Soil_Transect_2_3
[26] => Soil_Transect_1_3
[27] => SoilCO2_West_A_3
[28] => SoilCO2_West_B_3
[29] => SoilCO2_West_C_3
[30] => Tower_4
[31] => Floor_South_4
[32] => Floor_West_4
[33] => Soil_Transect_4_4
[34] => Soil_Transect_3_4
[35] => Soil_Transect_2_4
[36] => Soil_Transect_1_4
[37] => SoilCO2_West_A_4
[38] => SoilCO2_West_B_4
[39] => SoilCO2_West_C_4
)
| Date | DOY | Rep | Depth | Tower_1 |
Floor_South_1 |
Floor_West_1 |
Soil_Transect_4_1 |
Soil_Transect_3_1 |
Soil_Transect_2_1 |
Soil_Transect_1_1 |
SoilCO2_West_A_1 |
SoilCO2_West_B_1 |
SoilCO2_West_C_1 |
Tower_2 |
Floor_South_2 |
Floor_West_2 |
Soil_Transect_4_2 |
Soil_Transect_3_2 |
Soil_Transect_2_2 |
Soil_Transect_1_2 |
SoilCO2_West_A_2 |
SoilCO2_West_B_2 |
SoilCO2_West_C_2 |
Tower_3 |
Floor_South_3 |
Floor_West_3 |
Soil_Transect_4_3 |
Soil_Transect_3_3 |
Soil_Transect_2_3 |
Soil_Transect_1_3 |
SoilCO2_West_A_3 |
SoilCO2_West_B_3 |
SoilCO2_West_C_3 |
Tower_4 |
Floor_South_4 |
Floor_West_4 |
Soil_Transect_4_4 |
Soil_Transect_3_4 |
Soil_Transect_2_4 |
Soil_Transect_1_4 |
SoilCO2_West_A_4 |
SoilCO2_West_B_4 |
SoilCO2_West_C_4 |
Avg | Spacial Count |
Measurement Count |
|---|---|---|---|---|---|---|---|---|---|---|---|---|---|---|---|---|---|---|---|---|---|---|---|---|---|---|---|---|---|---|---|---|---|---|---|---|---|---|---|---|---|---|---|---|---|---|
| 2020-04-01 | 92 | 0 | nan | 32 | 20.3 | 25.8 | 20 | 21.2 | 25.6 | 22 | 32.5 | 30.5 | 26.1 | 31.6 | 34.4 | 32.6 | 28 | 32.3 | 31.6 | 19.4 | 27.4 | 20.3 | 31 | 32.4 | 39.9 | 36 | 30.1 | 32.4 | 34.1 | 32.4 | 35.4 | 34.9 | 37.7 | 40.8 | 48.6 | 42.3 | 33.7 | 43.4 | 48.8 | 33.4 | 44.5 | 49.7 | 48.3 | |||
| 2020-04-01 | 92 | 1 | nan | 20.6 | 25.8 | 20.3 | 15.9 | 24.7 | 21.4 | 33.2 | 32.9 | 25.6 | 34.4 | 32.3 | 28.3 | 31 | 31.3 | 19.7 | 26.8 | 19.4 | 30.1 | 39.6 | 40.2 | 35.7 | 31.3 | 32.4 | 34.9 | 32.7 | 35.4 | 34.9 | 37.4 | 41.1 | 48 | 42 | 34.5 | 43.4 | 48.3 | 33.4 | 44.8 | 49.4 | 46.6 | |||||
| 2020-04-01 | 92 | Avg | 0-15cm | 0 | 0 | |||||||||||||||||||||||||||||||||||||||||
| 2020-04-01 | 92 | Avg | 15-30cm | 0 | 0 | |||||||||||||||||||||||||||||||||||||||||
| 2020-04-01 | 92 | Avg | 30-45cm | 0 | 0 | |||||||||||||||||||||||||||||||||||||||||
| 2020-04-01 | 92 | Avg | 45-60cm | 0 | 0 |
mode = both
Moisture Point Probes VR
Array
(
[0] => Flux_Tower_1
[1] => Flux_Tower_2
[2] => Biomass_Cage_2
[3] => Flux_Tower_3
[4] => Biomass_Cage_3
[5] => Flux_Tower_4
[6] => Biomass_Cage_4
[7] => Biomass_Cage_1
)
| Date | DOY | Rep | Depth | Flux_Tower_1 |
Flux_Tower_2 |
Biomass_Cage_2 |
Flux_Tower_3 |
Biomass_Cage_3 |
Flux_Tower_4 |
Biomass_Cage_4 |
Biomass_Cage_1 |
Avg | Spacial Count |
Measurement Count |
|---|---|---|---|---|---|---|---|---|---|---|---|---|---|---|
| 2020-04-01 | 92 | 0 | nan | 15.9 | 30.4 | 19.1 | 16.5 | 34.3 | 27.9 | 31.9 | ||||
| 2020-04-01 | 92 | 1 | nan | 15.3 | 30.1 | 17.6 | 16.2 | 32.1 | 28.5 | 30.5 | 16.5 | |||
| 2020-04-01 | 92 | Avg | 0-15cm | 0 | 0 | |||||||||
| 2020-04-01 | 92 | Avg | 15-30cm | 0 | 0 | |||||||||
| 2020-04-01 | 92 | Avg | 30-45cm | 0 | 0 | |||||||||
| 2020-04-01 | 92 | Avg | 45-60cm | 0 | 0 |
No TZ grass heigth found
Grass Height VR 10
| Date | Height reps (cm) | Location | Average | Samp | STDEV | |||||||||
|---|---|---|---|---|---|---|---|---|---|---|---|---|---|---|
| 2020-04-01 | 21 | 10 | 9 | 12 | 10 | 18 | 12 | 11 | 8 | 9 | GH_ALL | 12 | 10 | 4 |
No VR Tree DBH found
No water potential data found
No VR Grass Biomass data found
No VR OakLeaves Biomass data found
No VR PineNeedles Biomass data found
1 photos found
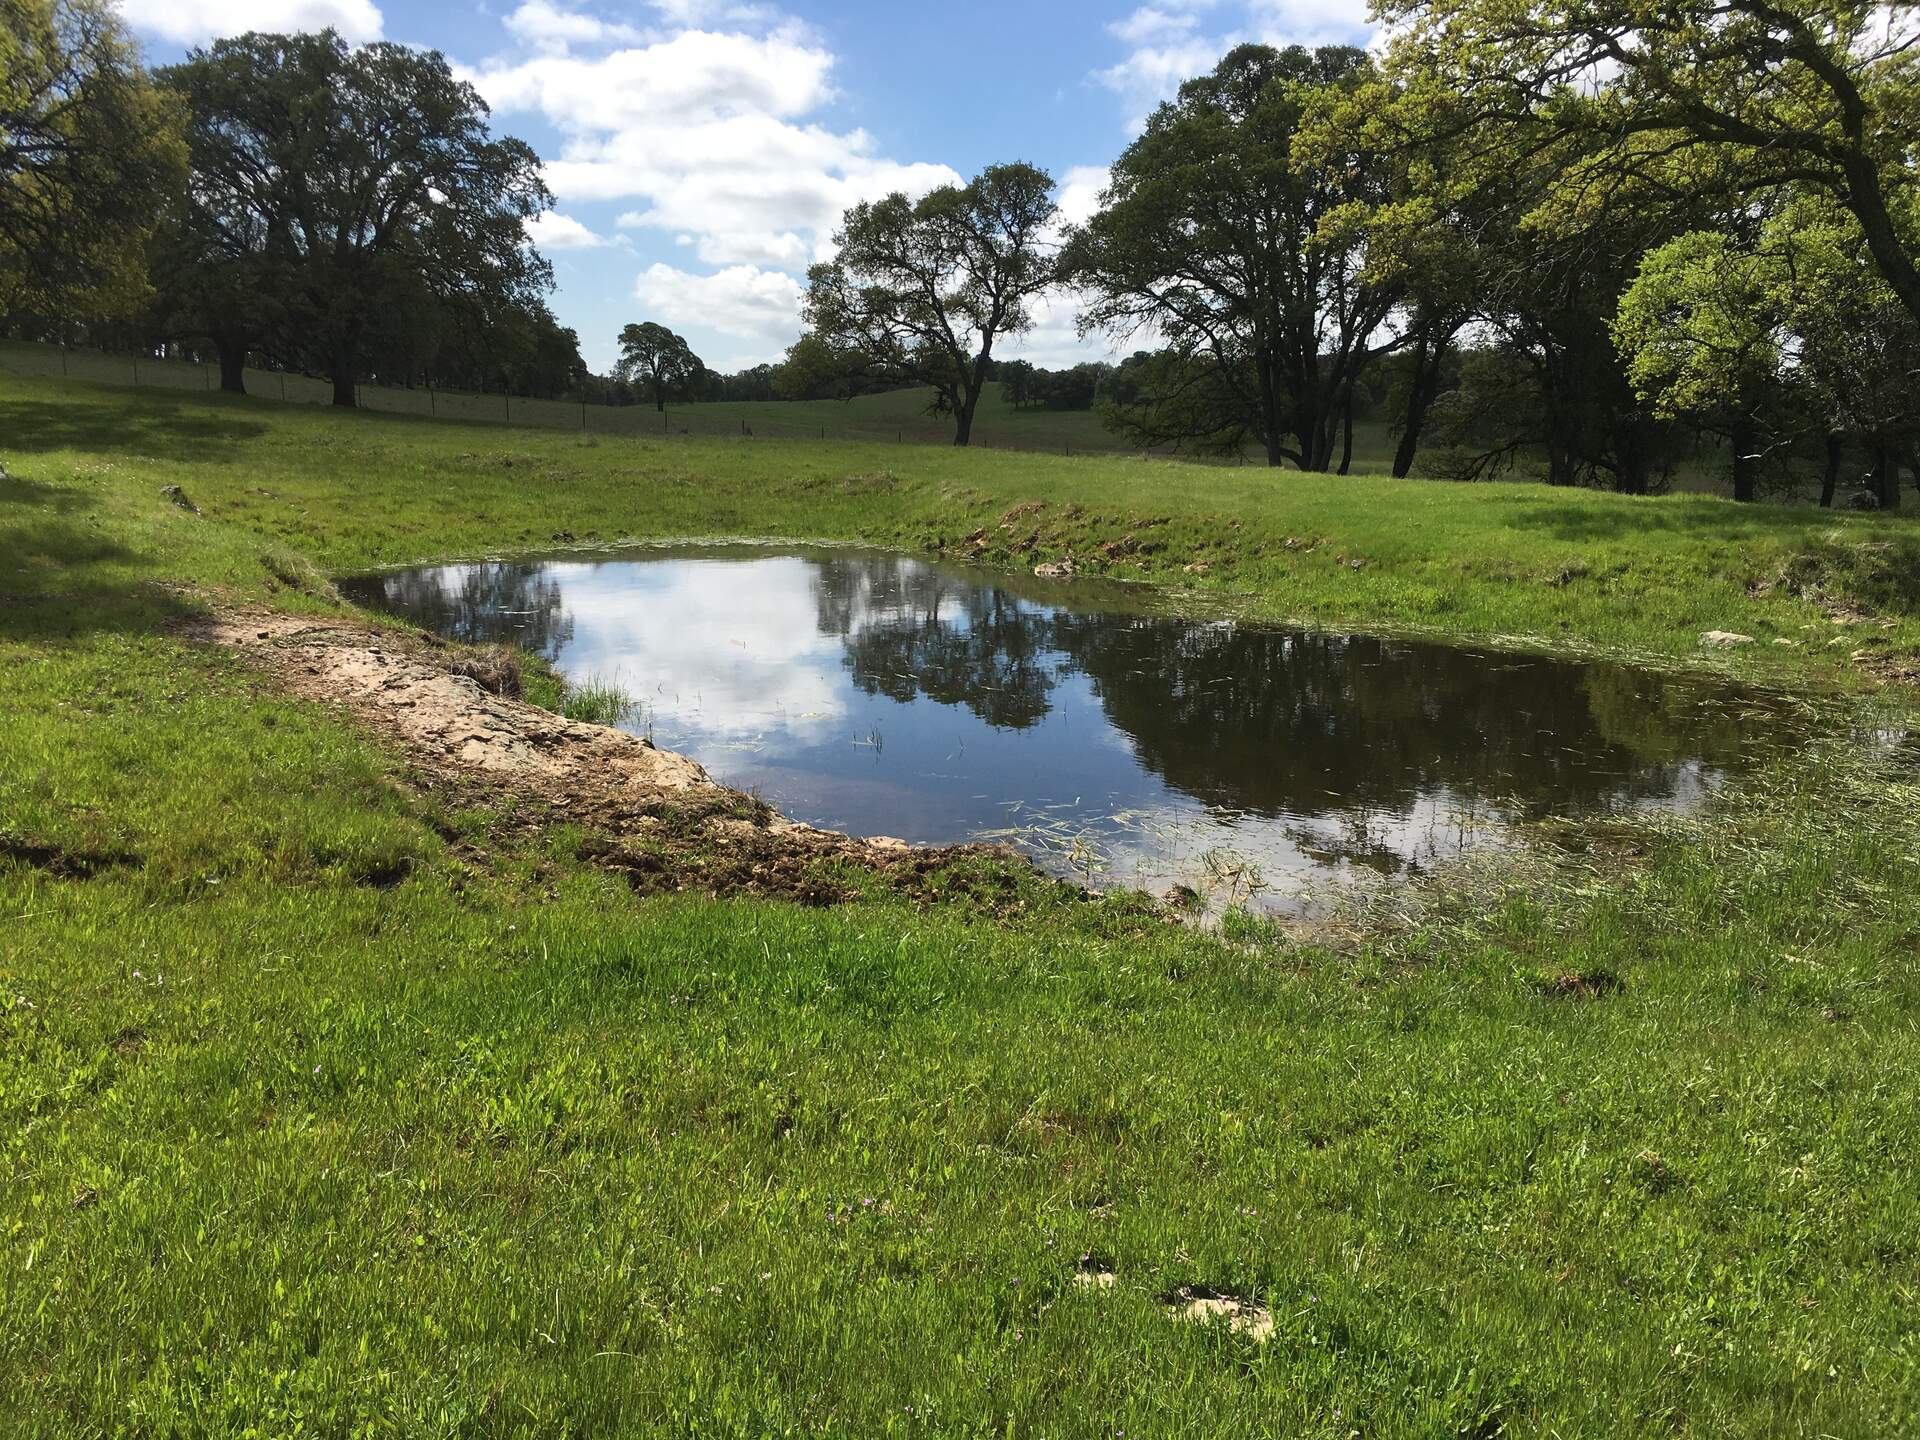
20200401VR_Waterhole.jpg ( 2020-04-01 00:00:00 ) Full size: 1920x1440
The waterhole is finally full
9 sets found
16 VR_met graphs found
2 VR_flux graphs found
6 VR_soilco2 graphs found
2 VR_pond graphs found
Can't check TZVR_mixed
No data found for VR_fd.
No data found for VR_processed.
4 VR_arable graphs found
No data found for VR_soilvue.