
Field Notes
<--2020-04-01 11:45:00 | 2020-05-05 10:00:00-->Other sites visited today: Vaira
Phenocam link: Searching...
Tonzi: 2020-04-18 10:00:00 (DOY 109)
Author: Joe Verfaillie
Others: Hisashi, Kyoko
Summary: Trees fully leafed out, Added below canopy PAR, Cluster Tree 8 dead - dendrometer moved to Tree 5, z-cam 3 tilted - fixed, dimensions for Miriam
| Tonzi 2020-04-18 Hisashi, Kyoko and I arrived at about 10:00. It was mild, overcast and still. It kind of felt like the world was holding its breath waiting for something. The pond has come up to about 2/3 full. There were a few small puddles in the road. The trees have full leaves now but still light green – midday water potential next time. There are some flowers around. I collected data and Hisashi and Kyoko did soil moisture and well measurements. I found the missing data from several weeks ago for the IRT and co2 profile systems. But the IRT hasn’t sent any new data and I didn’t discover this until I got home and started to put data away. Also the ground IRT was out of its mount again but still pointed at the ground. I added a below canopy PAR sensor sn 110340 to the zcam-2 post. I might have moved the z-cam a tiny bit. The PAR sensor is connected the Floor Met CR23X. I downloaded its data and uploaded a new program. I collected data from the FD chambers but did not clear their memory. Power was okay here now that I fixed the loose wire last time. I made some more measurements of FLIR related stuff for Miriam. The IRTs pointed at the tree were misaligned again. I realigned them and tried to tighten the mount. I serviced the z-cams. Looks like a cow got inside the fence around the Floor tower and leaned on z-cam 3 – it was bent to the southwest. I straightened it up again but there may be some bad (unusual) photos in this batch. In putting the z-cam photos away, I also notice that the times for the z-cam 1 and 2 seem to be about two hours early. Probably something wrong in the new program on the CR6 – need to check it next time. I read the DBH gauges. Cluster tree 8 has died. I removed the two denrometer bands but left the metal id tags. I installed the Vernier scale band on Tree 5 that has been without a band for a long while. The DBH for Tree 5 today is 40.0cm. Another small tree (tag# ) near Tree 8 has also died recently, two others towards the tower died a while back, one by the z-cam and one by the tower guy wires have also died. So six trees all in the same area in the last few years. We left at about 13:00 |
Field Data
No tank data
Well Depth
| Date | Location | Depth (feet) |
|---|---|---|
| 2020-04-18 | TZ_road | 36.2 |
| 2020-04-18 | TZ_floor | 27.7 |
| 2020-04-18 | TZ_tower | 31.7 |
| 2020-04-18 | VR_well | 54.6 |
mode = both
Moisture Point Probes TZ
Array
(
[0] => Tower_1
[1] => Floor_South_1
[2] => Floor_West_1
[3] => Soil_Transect_4_1
[4] => Soil_Transect_3_1
[5] => Soil_Transect_2_1
[6] => Soil_Transect_1_1
[7] => SoilCO2_West_A_1
[8] => SoilCO2_West_B_1
[9] => SoilCO2_West_C_1
[10] => Tower_2
[11] => Floor_South_2
[12] => Floor_West_2
[13] => Soil_Transect_4_2
[14] => Soil_Transect_3_2
[15] => Soil_Transect_2_2
[16] => Soil_Transect_1_2
[17] => SoilCO2_West_A_2
[18] => SoilCO2_West_B_2
[19] => SoilCO2_West_C_2
[20] => Tower_3
[21] => Floor_South_3
[22] => Floor_West_3
[23] => Soil_Transect_4_3
[24] => Soil_Transect_3_3
[25] => Soil_Transect_2_3
[26] => Soil_Transect_1_3
[27] => SoilCO2_West_A_3
[28] => SoilCO2_West_B_3
[29] => SoilCO2_West_C_3
[30] => Tower_4
[31] => Floor_South_4
[32] => Floor_West_4
[33] => Soil_Transect_4_4
[34] => Soil_Transect_3_4
[35] => Soil_Transect_2_4
[36] => Soil_Transect_1_4
[37] => SoilCO2_West_A_4
[38] => SoilCO2_West_B_4
[39] => SoilCO2_West_C_4
)
| Date | DOY | Rep | Depth | Tower_1 |
Floor_South_1 |
Floor_West_1 |
Soil_Transect_4_1 |
Soil_Transect_3_1 |
Soil_Transect_2_1 |
Soil_Transect_1_1 |
SoilCO2_West_A_1 |
SoilCO2_West_B_1 |
SoilCO2_West_C_1 |
Tower_2 |
Floor_South_2 |
Floor_West_2 |
Soil_Transect_4_2 |
Soil_Transect_3_2 |
Soil_Transect_2_2 |
Soil_Transect_1_2 |
SoilCO2_West_A_2 |
SoilCO2_West_B_2 |
SoilCO2_West_C_2 |
Tower_3 |
Floor_South_3 |
Floor_West_3 |
Soil_Transect_4_3 |
Soil_Transect_3_3 |
Soil_Transect_2_3 |
Soil_Transect_1_3 |
SoilCO2_West_A_3 |
SoilCO2_West_B_3 |
SoilCO2_West_C_3 |
Tower_4 |
Floor_South_4 |
Floor_West_4 |
Soil_Transect_4_4 |
Soil_Transect_3_4 |
Soil_Transect_2_4 |
Soil_Transect_1_4 |
SoilCO2_West_A_4 |
SoilCO2_West_B_4 |
SoilCO2_West_C_4 |
Avg | Spacial Count |
Measurement Count |
|---|---|---|---|---|---|---|---|---|---|---|---|---|---|---|---|---|---|---|---|---|---|---|---|---|---|---|---|---|---|---|---|---|---|---|---|---|---|---|---|---|---|---|---|---|---|---|
| 2020-04-18 | 109 | 0 | nan | 29.7 | 15.9 | 19.7 | 14.4 | 17.3 | 21.3 | 12.7 | 30.2 | 28.2 | 26.7 | 31.9 | 30.1 | 31.3 | 27.1 | 29.2 | 29.8 | 17.9 | 24.9 | 17.9 | 28.6 | 31 | 38.2 | 35.2 | 28.8 | 29.3 | 33.5 | 30.7 | 33.8 | 33.5 | 37.4 | 41.7 | 51.7 | 43.3 | 32.8 | 42 | 49.7 | 32.2 | 45.1 | 50.6 | 50.9 | |||
| 2020-04-18 | 109 | 1 | nan | 30.5 | 15.6 | 20.6 | 14.1 | 17.9 | 21.4 | 11.2 | 31.4 | 28.2 | 27 | 31.9 | 29.8 | 31.3 | 26.5 | 29.2 | 29.8 | 17.6 | 26.1 | 17 | 29.5 | 29.6 | 37.7 | 36 | 28.8 | 29.9 | 33.8 | 31.3 | 34.6 | 33.8 | 38 | 42 | 50.9 | 40.8 | 34.4 | 42.5 | 48 | 31.9 | 45.1 | 50.9 | 49.4 | |||
| 2020-04-18 | 109 | Avg | 0-15cm | 0 | 0 | |||||||||||||||||||||||||||||||||||||||||
| 2020-04-18 | 109 | Avg | 15-30cm | 0 | 0 | |||||||||||||||||||||||||||||||||||||||||
| 2020-04-18 | 109 | Avg | 30-45cm | 0 | 0 | |||||||||||||||||||||||||||||||||||||||||
| 2020-04-18 | 109 | Avg | 45-60cm | 0 | 0 |
mode = both
Moisture Point Probes VR
Array
(
[0] => Flux_Tower_1
[1] => Biomass_Cage_1
[2] => Flux_Tower_2
[3] => Biomass_Cage_2
[4] => Flux_Tower_3
[5] => Biomass_Cage_3
[6] => Flux_Tower_4
[7] => Biomass_Cage_4
)
| Date | DOY | Rep | Depth | Flux_Tower_1 |
Biomass_Cage_1 |
Flux_Tower_2 |
Biomass_Cage_2 |
Flux_Tower_3 |
Biomass_Cage_3 |
Flux_Tower_4 |
Biomass_Cage_4 |
Avg | Spacial Count |
Measurement Count |
|---|---|---|---|---|---|---|---|---|---|---|---|---|---|---|
| 2020-04-18 | 109 | 0 | nan | 10.9 | 7.7 | 26.5 | 15.8 | 14 | 26.6 | 24.5 | 30.2 | |||
| 2020-04-18 | 109 | 1 | nan | 10.3 | 8 | 26.8 | 16.1 | 13.1 | 24.6 | 25.4 | 27.6 | |||
| 2020-04-18 | 109 | Avg | 0-15cm | 0 | 0 | |||||||||
| 2020-04-18 | 109 | Avg | 15-30cm | 0 | 0 | |||||||||
| 2020-04-18 | 109 | Avg | 30-45cm | 0 | 0 | |||||||||
| 2020-04-18 | 109 | Avg | 45-60cm | 0 | 0 |
No TZ grass heigth found
No VR grass heigth found
Tree DBH
| Date | Tag# | Reading (mm) |
|---|---|---|
| 2020-04-18 | 1 | 23.3 |
| 2020-04-18 | 102 | 15.7 |
| 2020-04-18 | 2 | 22.6 |
| 2020-04-18 | 245 | 12.5 |
| 2020-04-18 | 3 | 15.5 |
| 2020-04-18 | 4 | 8.3 |
| 2020-04-18 | 5 | 15.6 |
| 2020-04-18 | 6 | 5.4 |
| 2020-04-18 | 7 | 19.2 |
| 2020-04-18 | 72 | 7.2 |
| 2020-04-18 | 79 | 20.3 |
| 2020-04-18 | 8 | 2.3 |
No water potential data found
No TZ Grass Biomass data found
No TZ OakLeaves Biomass data found
No TZ PineNeedles Biomass data found
2 photos found
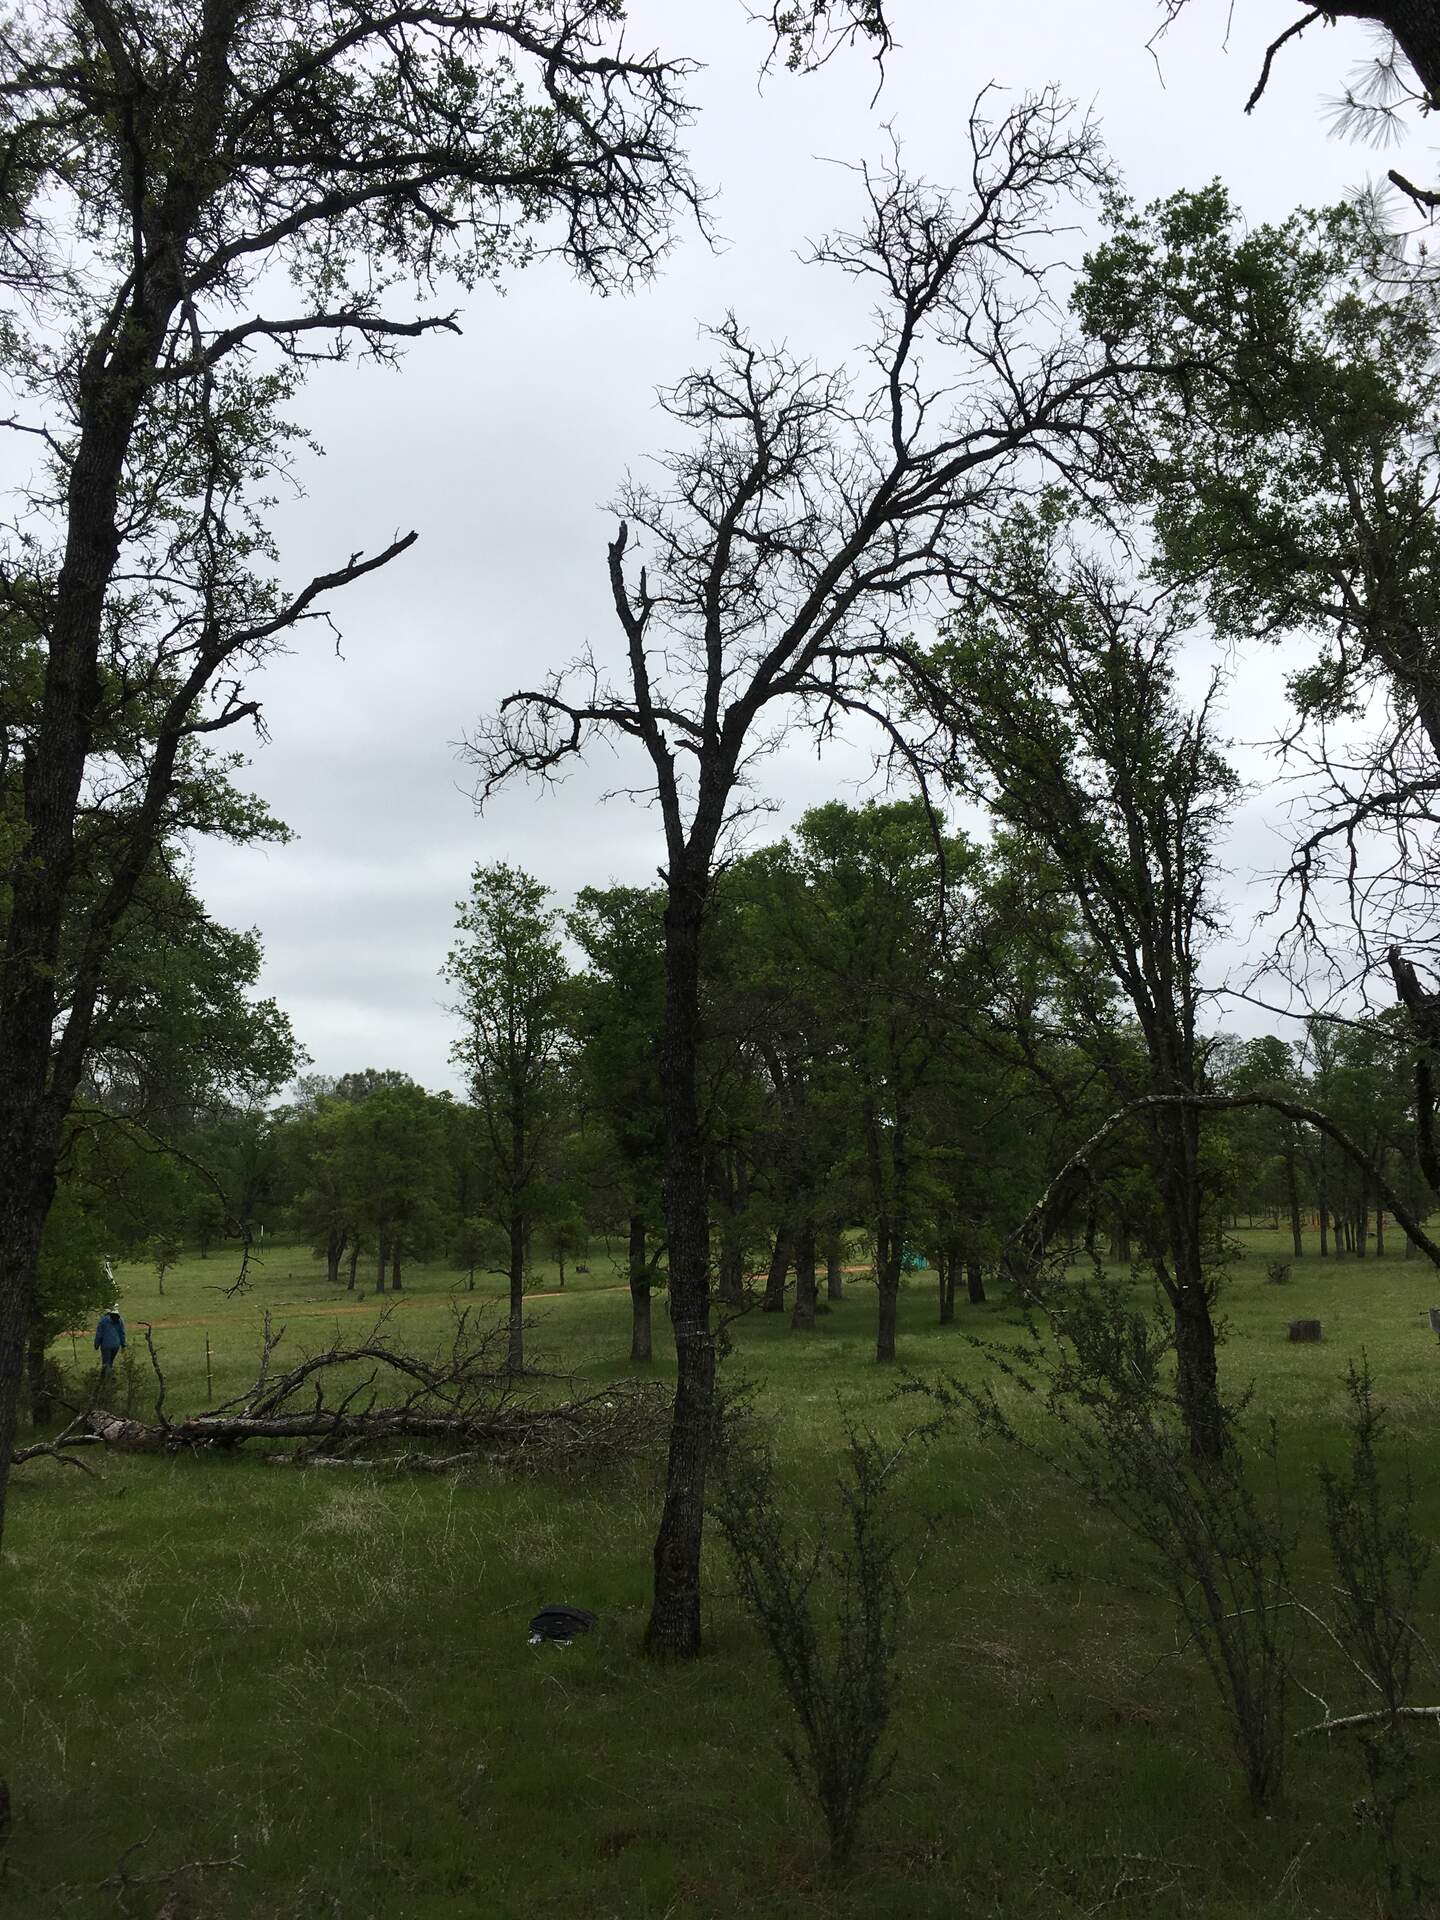
20200418TZ_Tree8Dead.jpg ( 2020-04-18 00:00:00 ) Full size: 1440x1920
Cluster Tree 8 has died

20200418TZ_Pond.jpg ( 2020-04-18 00:00:00 ) Full size: 1920x1440
Tonzi pond still not full
16 sets found
No data found for TZ_Fenergy.
11 TZ_tmet graphs found
11 TZ_soilco2 graphs found
Can't check TZ_mixed
3 TZ_mixed graphs found
1 TZ_fflux graphs found
8 TZ_fmet graphs found
No data found for TZ_tram.
3 TZ_co2prof graphs found
1 TZ_irt graphs found
No data found for TZ_windprof.
1 TZ_tflux graphs found
2 TZ_sm graphs found
Can't check TZ_met
1 TZ_met graphs found
Can't check TZVR_mixed
8 TZ_osu graphs found
3 TZ_fd graphs found
Tonzi Z-cam data