
Field Notes
<--2020-02-12 12:00:00 | 2020-03-02 09:45:00-->Other sites visited today: Vaira | Bouldin Corn | Mayberry
Phenocam link: Searching...
Tonzi: 2020-02-27 12:00:00 (DOY 58)
Author: Joe Verfaillie
Others: Daphne
Summary: Standard fieldwork, dry and warm, no phenocam images, made some measurements of tower sensor locations
| Tonzi 2020-02-27 Daphne and I arrived about 12:00 noon. It was clear, sunny and hot. The pond level is still low and the ground surface is dry. The puddles in the road are now cracked mud. The grass looks yellow. There were cows around the water station. I collected the eddy and data logger data. I also serviced the z-cams. Daphne did the soil moisture, tree DBH and manual well measurements. No images were recorded by the phenocam. I’m not sure what the problem was. The camera was running and had good time. FTP from the camera to the CR1000 worked and the script ran fine. Hopefully it was just bug with the card not getting mounted right the last time. I also tried to make some measurements of equipment locations with the laser range finder but a lot of the long distances on the tower are beyond its range. The FLIR is 18.4m above the ground The CNR is 2.8m S, 0.4mW of the SE corner The PAR sensors are 2.8m S, 0.3m E of the SE corner The BF5 is 1.64m S of the SE corner The SRS reflected sensors are 2.77m S, 10cm E of the SE corner The HMP45 is 20cm W of the SW corner The Arable is 0.66m S of the middle of the south edge. I collected the FD Chamber data but did not clear the memories. I removed the solar panel from the Road Well post. It has not been used for a long while. The battery there is dropping close to 12V, we should swap it for a lithium rechargeable. We left at about 2pm. |
Field Data
No tank data
Well Depth
| Date | Location | Depth (feet) |
|---|---|---|
| 2020-02-27 | VR_pond | 17.22 |
No TZ Moisture Point data found
mode = both
Moisture Point Probes VR
Array
(
[0] => Flux_Tower_1
[1] => Biomass_Cage_1
[2] => Flux_Tower_2
[3] => Biomass_Cage_2
[4] => Flux_Tower_3
[5] => Biomass_Cage_3
[6] => Flux_Tower_4
[7] => Biomass_Cage_4
)
| Date | DOY | Rep | Depth | Flux_Tower_1 |
Biomass_Cage_1 |
Flux_Tower_2 |
Biomass_Cage_2 |
Flux_Tower_3 |
Biomass_Cage_3 |
Flux_Tower_4 |
Biomass_Cage_4 |
Avg | Spacial Count |
Measurement Count |
|---|---|---|---|---|---|---|---|---|---|---|---|---|---|---|
| 2020-02-27 | 58 | 0 | nan | 8 | 5.3 | 23.7 | 13 | 11.7 | 22.3 | 23.4 | 23.1 | |||
| 2020-02-27 | 58 | 1 | nan | 6.8 | 5.3 | 23.1 | 13.6 | 12.3 | 22.1 | 23.9 | 23.9 | |||
| 2020-02-27 | 58 | Avg | 0-15cm | 0 | 0 | |||||||||
| 2020-02-27 | 58 | Avg | 15-30cm | 0 | 0 | |||||||||
| 2020-02-27 | 58 | Avg | 30-45cm | 0 | 0 | |||||||||
| 2020-02-27 | 58 | Avg | 45-60cm | 0 | 0 |
No TZ grass heigth found
Grass Height VR 10
| Date | Height reps (cm) | Location | Average | Samp | STDEV | |||||||||
|---|---|---|---|---|---|---|---|---|---|---|---|---|---|---|
| 2020-02-27 | 5 | 3 | 8 | 4 | 2 | 10 | 5 | 7 | 5 | 4 | GH_ALL | 5.3 | 10 | 2.28 |
No TZ Tree DBH found
No water potential data found
No TZ Grass Biomass data found
No TZ OakLeaves Biomass data found
No TZ PineNeedles Biomass data found
2 photos found
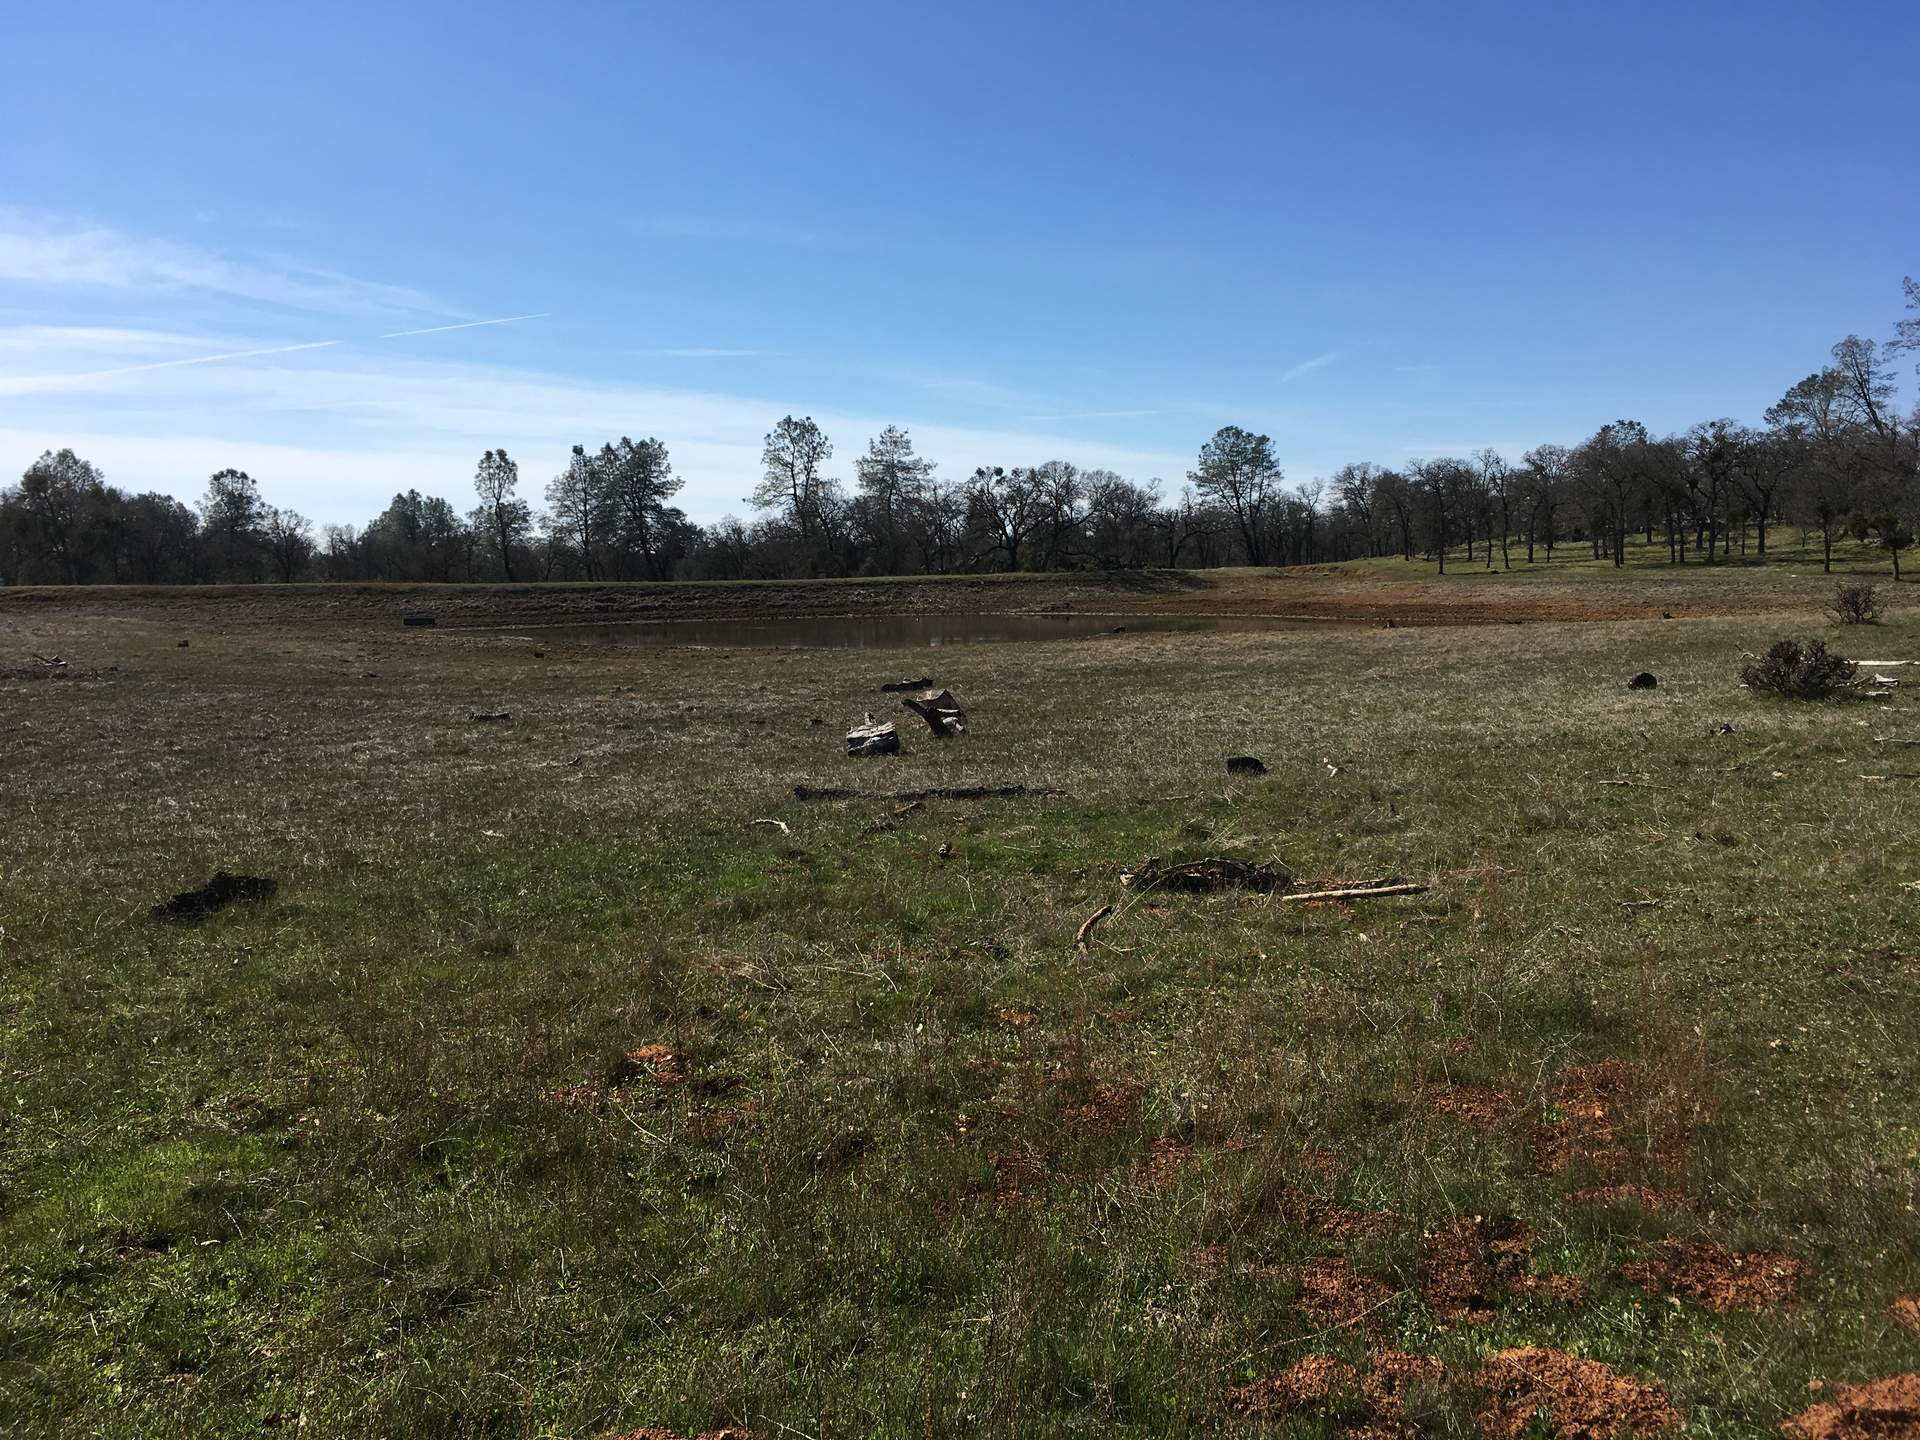
20200227TZ_Pond.jpg ( 2020-02-27 00:00:00 ) Full size: 1920x1440
Tonzi pond
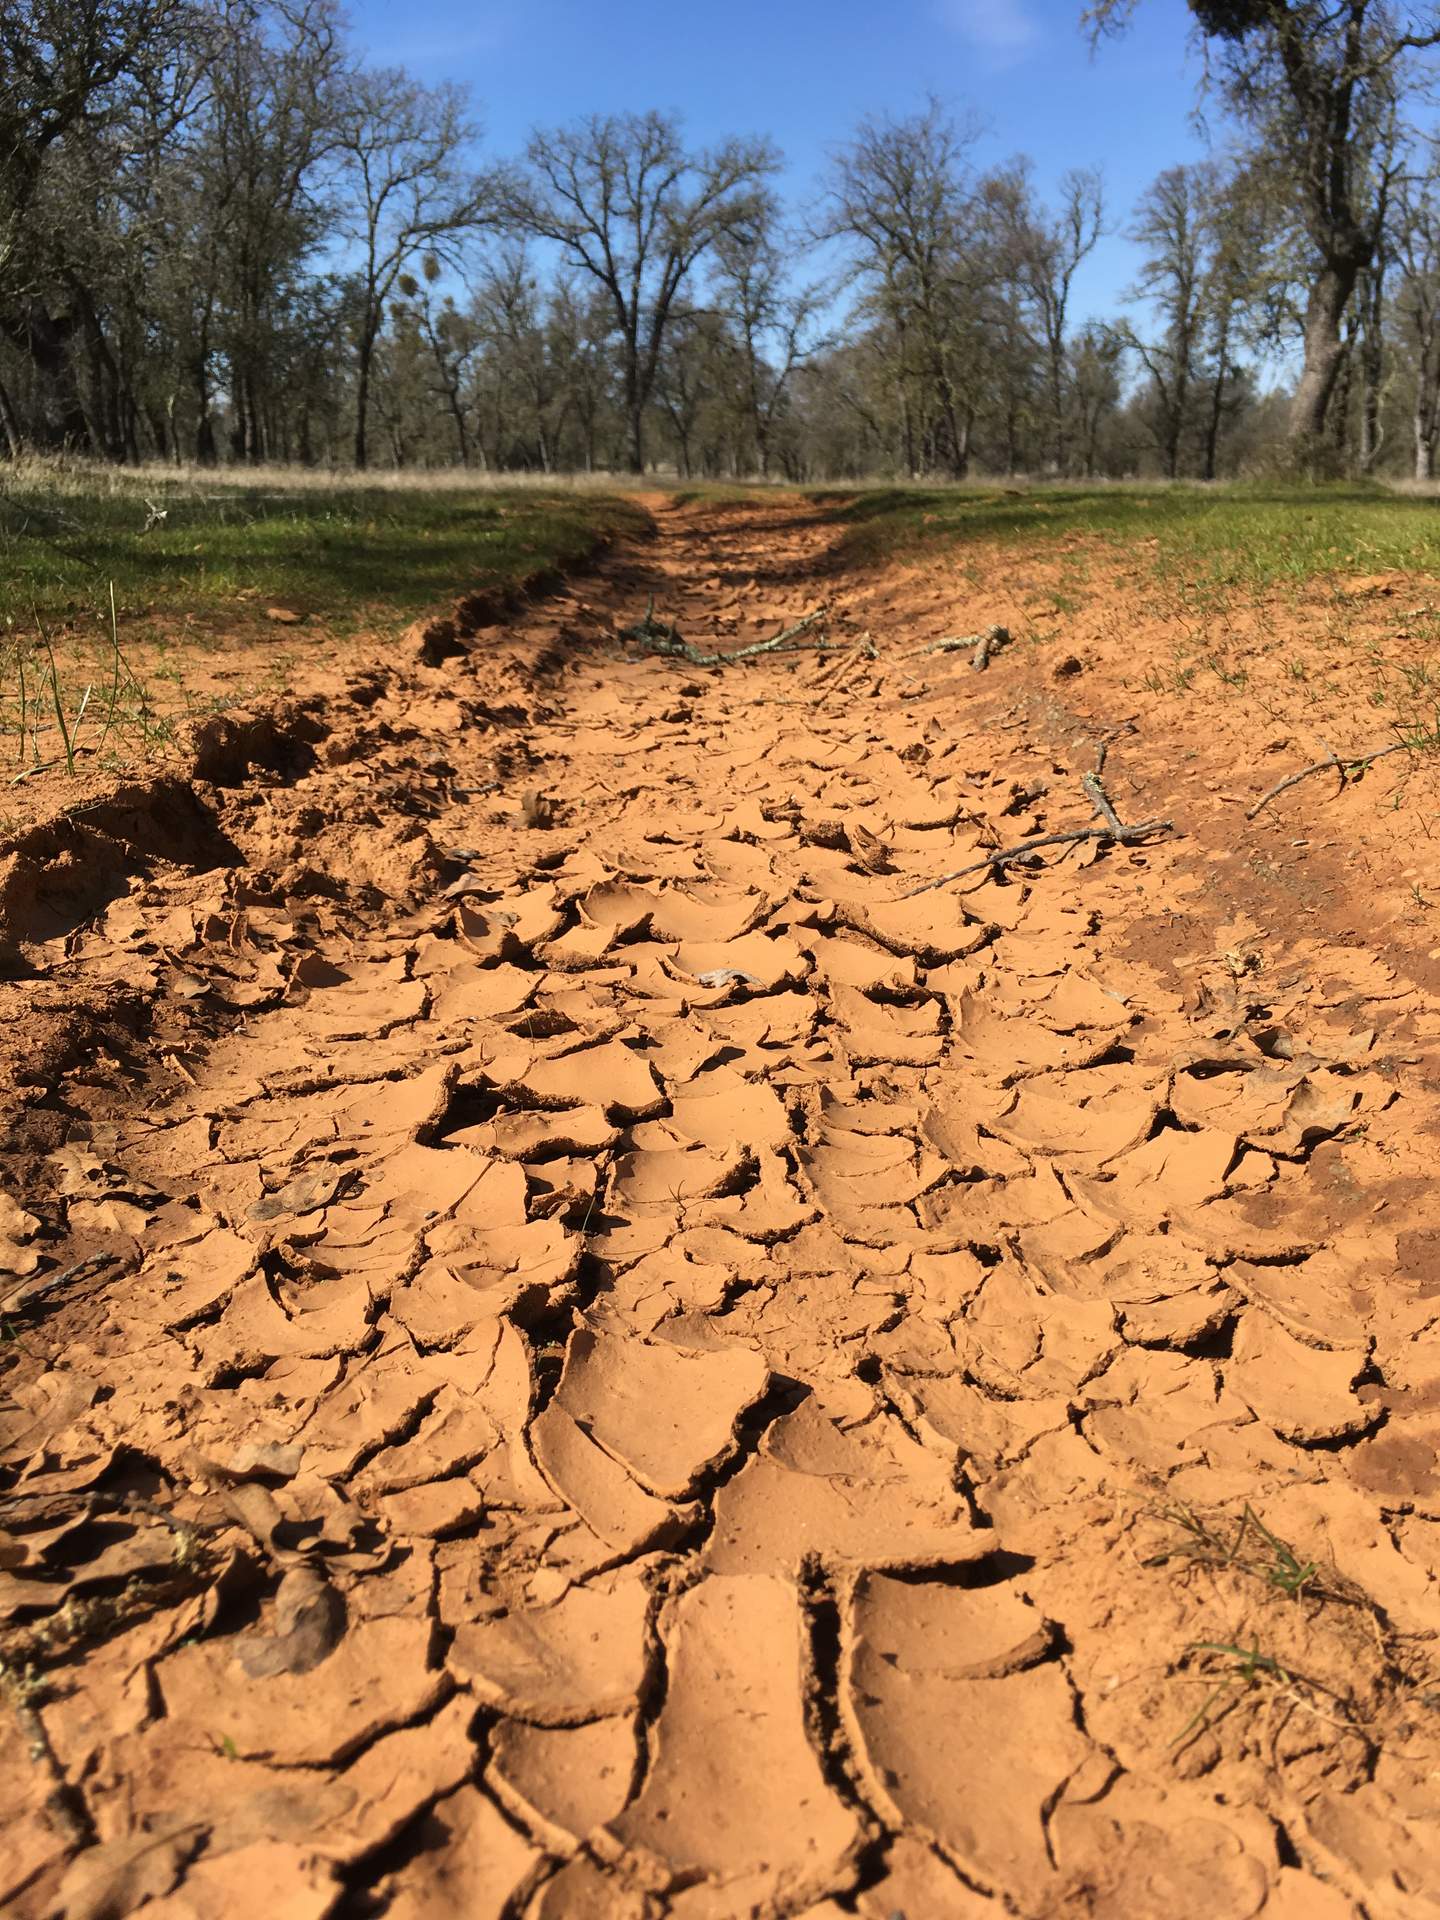
20200227TZ_DryMudPuddles.jpg ( 2020-02-27 00:00:00 ) Full size: 1440x1920
The mud puddles are dry in February
16 sets found
No data found for TZ_Fenergy.
11 TZ_tmet graphs found
11 TZ_soilco2 graphs found
Can't check TZ_mixed
3 TZ_mixed graphs found
1 TZ_fflux graphs found
8 TZ_fmet graphs found
No data found for TZ_tram.
3 TZ_co2prof graphs found
1 TZ_irt graphs found
No data found for TZ_windprof.
1 TZ_tflux graphs found
2 TZ_sm graphs found
Can't check TZ_met
1 TZ_met graphs found
Can't check TZVR_mixed
8 TZ_osu graphs found
3 TZ_fd graphs found
Tonzi Z-cam data