
Field Notes
<--2020-01-28 11:30:00 | 2020-02-27 12:00:00-->Other sites visited today: Bouldin Corn | Vaira | West Pond
Phenocam link: Searching...
Tonzi: 2020-02-12 12:00:00 (DOY 43)
Author: Joe Verfaillie
Others: Daphne
Summary: Standard fieldwork, grass looking yellow-brown, IRT sensors out of mounts, cow fences down, swapped 7500s
| Tonzi 2020-02-12 Daphne and I arrived at about 12:00 noon. It was clear, sunny and warm. The grass here looks very yellow-brown. The puddles in the road are now just muddy spots. The pond is still low. I collected the data and swapped 7500s for calibration: Tower sn 75H-2182 came down and sn 75H-2150 went up. sn 75H-2182 off: 419.3ppm CO2, 295mmol/m3 H2O, 99.2kPa, 16.9C, 99.9SS sn 75H-2150 on: 423.4ppm CO2, 274mmol/m3 H2O, 99.2kPa, 17.5C, 102.0SS Floor sn 0418 came down and sn 1594 went up. sn 0418 off: 418.0ppm CO2, 318mmol/m3 H2O, 99.3kPa, 18.9C, 95.6SS sn 1594 on: 425.6ppm CO2, 287mmol/m3 H2O, 99.3kPa, 19.1C, 101.4SS I collected the FD chamber data but did not clear the memory. A bunch of the IRT sensors were knocked out of position either by wind or animals. The two pointing at the tree trunk were misaligned. I realigned them but the mounting post might be loose in the ground. The one pointed at the grass near the solar panels was laying on the ground. I remounted it. And the original one pointed at the ground by the small tree was out of its mount but still mostly pointed at the ground. Its lab clamp is rusted and might need a new one. The cow fences around the Tower and soil CO2 site were also down. I fixed wires in both locations. Daphne did the manual soil moisture, DBH, well measurements and serviced the z-cams. We left at about 13:00 |
Field Data
No tank data
Well Depth
| Date | Location | Depth (feet) |
|---|---|---|
| 2020-02-12 | VR_well | 57.47 |
| 2020-02-12 | TZ_floor | 29.8 |
| 2020-02-12 | TZ_tower | 34.55 |
| 2020-02-12 | TZ_road | 38 |
mode = both
Moisture Point Probes TZ
Array
(
[0] => Tower_1
[1] => Floor_South_1
[2] => Floor_West_1
[3] => Soil_Transect_4_1
[4] => Soil_Transect_3_1
[5] => Soil_Transect_2_1
[6] => Soil_Transect_1_1
[7] => SoilCO2_West_A_1
[8] => SoilCO2_West_B_1
[9] => SoilCO2_West_C_1
[10] => Tower_2
[11] => Floor_South_2
[12] => Floor_West_2
[13] => Soil_Transect_4_2
[14] => Soil_Transect_3_2
[15] => Soil_Transect_2_2
[16] => Soil_Transect_1_2
[17] => SoilCO2_West_A_2
[18] => SoilCO2_West_B_2
[19] => SoilCO2_West_C_2
[20] => Tower_3
[21] => Floor_South_3
[22] => Floor_West_3
[23] => Soil_Transect_4_3
[24] => Soil_Transect_3_3
[25] => Soil_Transect_1_3
[26] => SoilCO2_West_A_3
[27] => SoilCO2_West_B_3
[28] => SoilCO2_West_C_3
[29] => Tower_4
[30] => Floor_South_4
[31] => Floor_West_4
[32] => Soil_Transect_4_4
[33] => Soil_Transect_3_4
[34] => Soil_Transect_2_4
[35] => Soil_Transect_1_4
[36] => SoilCO2_West_A_4
[37] => SoilCO2_West_B_4
[38] => SoilCO2_West_C_4
[39] => Soil_Transect_2_3
)
| Date | DOY | Rep | Depth | Tower_1 |
Floor_South_1 |
Floor_West_1 |
Soil_Transect_4_1 |
Soil_Transect_3_1 |
Soil_Transect_2_1 |
Soil_Transect_1_1 |
SoilCO2_West_A_1 |
SoilCO2_West_B_1 |
SoilCO2_West_C_1 |
Tower_2 |
Floor_South_2 |
Floor_West_2 |
Soil_Transect_4_2 |
Soil_Transect_3_2 |
Soil_Transect_2_2 |
Soil_Transect_1_2 |
SoilCO2_West_A_2 |
SoilCO2_West_B_2 |
SoilCO2_West_C_2 |
Tower_3 |
Floor_South_3 |
Floor_West_3 |
Soil_Transect_4_3 |
Soil_Transect_3_3 |
Soil_Transect_1_3 |
SoilCO2_West_A_3 |
SoilCO2_West_B_3 |
SoilCO2_West_C_3 |
Tower_4 |
Floor_South_4 |
Floor_West_4 |
Soil_Transect_4_4 |
Soil_Transect_3_4 |
Soil_Transect_2_4 |
Soil_Transect_1_4 |
SoilCO2_West_A_4 |
SoilCO2_West_B_4 |
SoilCO2_West_C_4 |
Soil_Transect_2_3 |
Avg | Spacial Count |
Measurement Count |
|---|---|---|---|---|---|---|---|---|---|---|---|---|---|---|---|---|---|---|---|---|---|---|---|---|---|---|---|---|---|---|---|---|---|---|---|---|---|---|---|---|---|---|---|---|---|---|
| 2020-02-12 | 43 | 0 | nan | 20.6 | 10.9 | 18.5 | 15 | 14.4 | 28.5 | 19.7 | 31.1 | 25 | 17.1 | 24.3 | 24 | 29.8 | 21 | 30.1 | 27.1 | 16.1 | 25.5 | 17 | 28 | 25.4 | 31.5 | 34.9 | 24.3 | 31.3 | 30.7 | 33.8 | 32.9 | 35.4 | 35.4 | 14.5 | 45.7 | 28.2 | 40.8 | 45.4 | 30.2 | 43.4 | 48.6 | 47.4 | ||||
| 2020-02-12 | 43 | 1 | nan | 21.4 | 10.9 | 21.7 | 15.6 | 13.8 | 28.2 | 20.9 | 30.2 | 24.1 | 17.6 | 23.1 | 23.7 | 28 | 21 | 29.8 | 27.4 | 15.5 | 24.3 | 15.8 | 28.9 | 26.8 | 31.3 | 33.5 | 24.6 | 31.3 | 30.1 | 33.8 | 32.4 | 36.3 | 35.4 | 14.8 | 29.1 | 41.1 | 45.4 | 29.1 | 43.1 | 48 | 47.7 | 38.5 | ||||
| 2020-02-12 | 43 | 2 | nan | 21.4 | 25.3 | 28.6 | 26.8 | 34.6 | 42.3 | 45.7 | 31.9 | |||||||||||||||||||||||||||||||||||
| 2020-02-12 | 43 | 3 | nan | 21.2 | 26.8 | 28 | 40.5 | 34.3 | 45.1 | 46.6 | ||||||||||||||||||||||||||||||||||||
| 2020-02-12 | 43 | 4 | nan | 27 | 27.4 | 49.1 | 38 | |||||||||||||||||||||||||||||||||||||||
| 2020-02-12 | 43 | Avg | 0-15cm | 0 | 0 | |||||||||||||||||||||||||||||||||||||||||
| 2020-02-12 | 43 | Avg | 15-30cm | 0 | 0 | |||||||||||||||||||||||||||||||||||||||||
| 2020-02-12 | 43 | Avg | 30-45cm | 0 | 0 | |||||||||||||||||||||||||||||||||||||||||
| 2020-02-12 | 43 | Avg | 45-60cm | 0 | 0 |
mode = both
Moisture Point Probes VR
Array
(
[0] => Flux_Tower_1
[1] => Biomass_Cage_1
[2] => Flux_Tower_2
[3] => Biomass_Cage_2
[4] => Flux_Tower_3
[5] => Biomass_Cage_3
[6] => Flux_Tower_4
[7] => Biomass_Cage_4
)
| Date | DOY | Rep | Depth | Flux_Tower_1 |
Biomass_Cage_1 |
Flux_Tower_2 |
Biomass_Cage_2 |
Flux_Tower_3 |
Biomass_Cage_3 |
Flux_Tower_4 |
Biomass_Cage_4 |
Avg | Spacial Count |
Measurement Count |
|---|---|---|---|---|---|---|---|---|---|---|---|---|---|---|
| 2020-02-12 | 43 | 0 | nan | 17.3 | 7.7 | 28.3 | 17.3 | 14.5 | 26.8 | 28.2 | 29.4 | |||
| 2020-02-12 | 43 | 1 | nan | 17.6 | 7.7 | 28.3 | 17.6 | 14.8 | 26 | 27.1 | 28.2 | |||
| 2020-02-12 | 43 | Avg | 0-15cm | 0 | 0 | |||||||||
| 2020-02-12 | 43 | Avg | 15-30cm | 0 | 0 | |||||||||
| 2020-02-12 | 43 | Avg | 30-45cm | 0 | 0 | |||||||||
| 2020-02-12 | 43 | Avg | 45-60cm | 0 | 0 |
No TZ grass heigth found
No VR grass heigth found
Tree DBH
| Date | Tag# | Reading (mm) |
|---|---|---|
| 2020-02-12 | 1 | 21.3 |
| 2020-02-12 | 102 | 12.4 |
| 2020-02-12 | 2 | 20.8 |
| 2020-02-12 | 3 | 14.1 |
| 2020-02-12 | 4 | 6.4 |
| 2020-02-12 | 6 | 15.4 |
| 2020-02-12 | 7 | 18.9 |
| 2020-02-12 | 72 | 5.0 |
| 2020-02-12 | 79 | 19.1 |
| 2020-02-12 | 8 | 3.9 |
No water potential data found
No TZ Grass Biomass data found
No TZ OakLeaves Biomass data found
No TZ PineNeedles Biomass data found
2 photos found

20200212TZ_GrassIsDying.jpg ( 2020-02-12 00:00:00 ) Full size: 1920x1440
The grass at Tonzi is turning brown
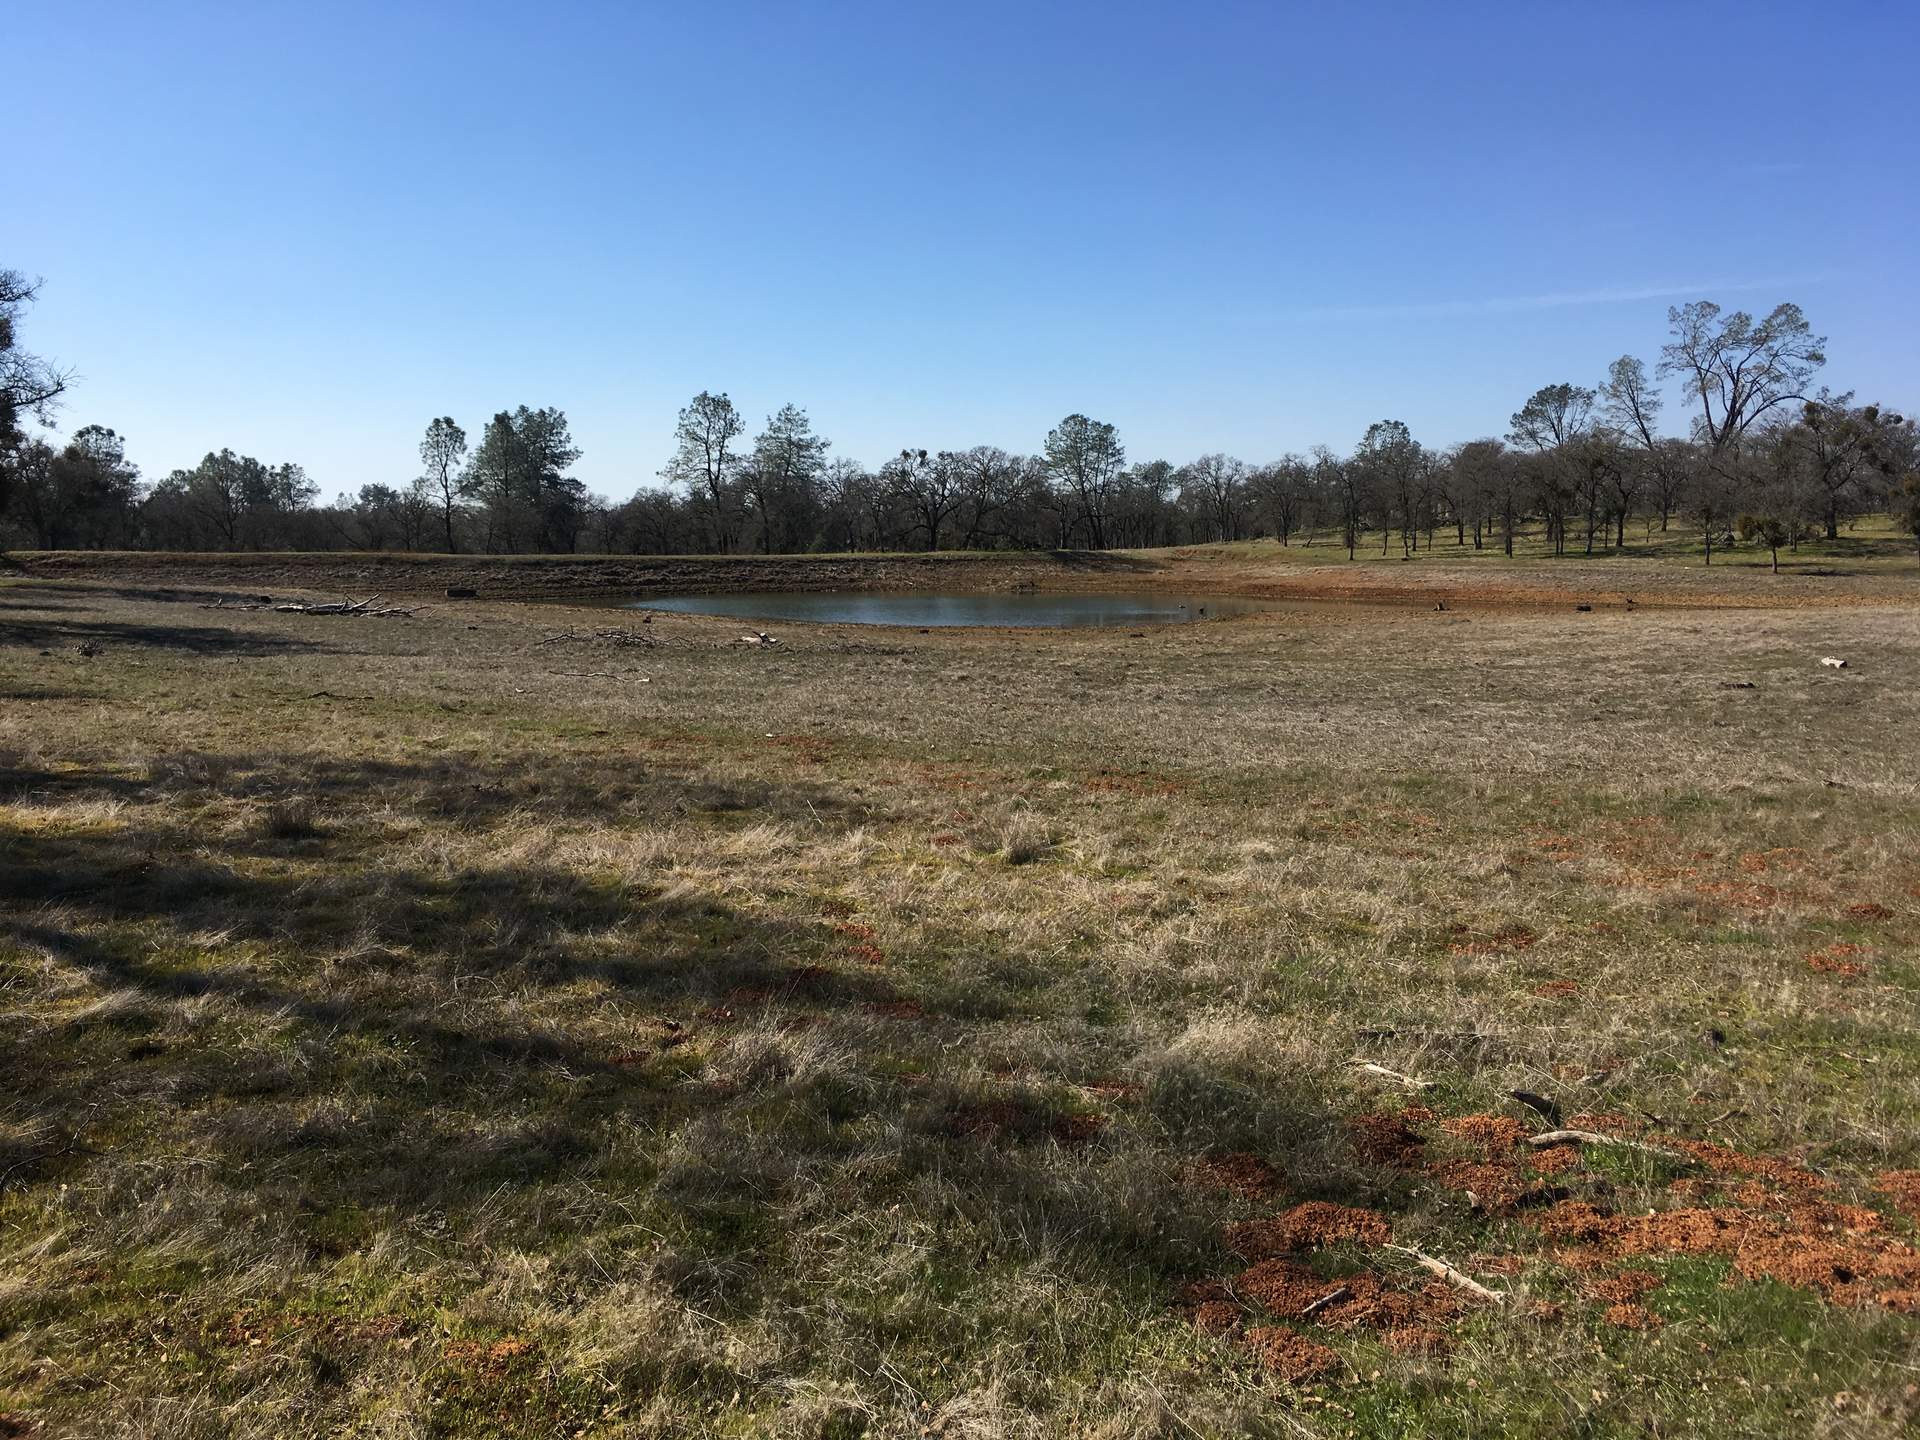
20200212TZ_Pond.jpg ( 2020-02-12 00:00:00 ) Full size: 1920x1440
Tonzi pond still low
16 sets found
No data found for TZ_Fenergy.
11 TZ_tmet graphs found
11 TZ_soilco2 graphs found
Can't check TZ_mixed
3 TZ_mixed graphs found
1 TZ_fflux graphs found
8 TZ_fmet graphs found
No data found for TZ_tram.
3 TZ_co2prof graphs found
1 TZ_irt graphs found
No data found for TZ_windprof.
1 TZ_tflux graphs found
2 TZ_sm graphs found
Can't check TZ_met
1 TZ_met graphs found
Can't check TZVR_mixed
8 TZ_osu graphs found
3 TZ_fd graphs found
Tonzi Z-cam data