
Field Notes
<--2020-01-28 10:15:00 | 2020-02-27 11:30:00-->Other sites visited today: Bouldin Corn | Tonzi | West Pond
Phenocam link: Searching...
Vaira: 2020-02-12 11:00:00 (DOY 43)
Author: Joe Verfaillie
Others: Daphne
Summary: Clear, sunny and warm, standard field work, swapped 7500, met Rick Littlefield
| Vaira 2020-02-12 Daphne and I arrived at about 11:00. It was clear sunny and warm. The puddles on the road have dried up. The water hole is only about half full. I met Rick Littlefield, a neighbor who has leeway across the Vaira Ranch. I asked about the lack of rain and he said it’s not so bad yet as the temperatures have been cold and the grass is not growing fast yet. Here the grass looks green, was damp with dew and is very dense but still only about 5cm high. At Tonzi there are definite brown patches. Rick also said he would be improving the road (adding culverts) and I gave him my contact info so he can tell us when the road is impassible. Daphne collected the data, measured the well, did spectral measurements and cleaned the rad sensors. I did the moisture point measurement. The probe near the tower seems to be bad – the top two readings look bad for sure, maybe the others. I also took three clip plots. The grass was very dense and small. It took three hours to sort the green from the dead and even then it was impossible to sort it completely. I ran the green samples through the LAI scanner three times each with relatively good agreement between runs. The grass was sprinkled onto the scanner belt so there was considerable overlap of leaves but maybe not as much as shading in situ. We left at noon and forgot to swap the 7500 for calibration but came back at 2pm after visiting Tonzi: sn 0035 came down and sn 0073 went up. sn 0035 off: 424.7ppm CO2, 292.5mmol/m3 H2O, 99.6kPa, 24.5C, 99.4SS sn 0073 on: 419.1ppm CO2, 302.2mmol/m3 H2O, 99.7kPa, 21.9C, 102.0SS We left about 14:15 |
Field Data
No tank data
Well Depth
| Date | Location | Depth (feet) |
|---|---|---|
| 2020-02-12 | VR_well | 57.47 |
| 2020-02-12 | TZ_floor | 29.8 |
| 2020-02-12 | TZ_tower | 34.55 |
| 2020-02-12 | TZ_road | 38 |
mode = both
Moisture Point Probes TZ
Array
(
[0] => Tower_1
[1] => Floor_South_1
[2] => Floor_West_1
[3] => Soil_Transect_4_1
[4] => Soil_Transect_3_1
[5] => Soil_Transect_2_1
[6] => Soil_Transect_1_1
[7] => SoilCO2_West_A_1
[8] => SoilCO2_West_B_1
[9] => SoilCO2_West_C_1
[10] => Tower_2
[11] => Floor_South_2
[12] => Floor_West_2
[13] => Soil_Transect_4_2
[14] => Soil_Transect_3_2
[15] => Soil_Transect_2_2
[16] => Soil_Transect_1_2
[17] => SoilCO2_West_A_2
[18] => SoilCO2_West_B_2
[19] => SoilCO2_West_C_2
[20] => Tower_3
[21] => Floor_South_3
[22] => Floor_West_3
[23] => Soil_Transect_4_3
[24] => Soil_Transect_3_3
[25] => Soil_Transect_1_3
[26] => SoilCO2_West_A_3
[27] => SoilCO2_West_B_3
[28] => SoilCO2_West_C_3
[29] => Tower_4
[30] => Floor_South_4
[31] => Floor_West_4
[32] => Soil_Transect_4_4
[33] => Soil_Transect_3_4
[34] => Soil_Transect_2_4
[35] => Soil_Transect_1_4
[36] => SoilCO2_West_A_4
[37] => SoilCO2_West_B_4
[38] => SoilCO2_West_C_4
[39] => Soil_Transect_2_3
)
| Date | DOY | Rep | Depth | Tower_1 |
Floor_South_1 |
Floor_West_1 |
Soil_Transect_4_1 |
Soil_Transect_3_1 |
Soil_Transect_2_1 |
Soil_Transect_1_1 |
SoilCO2_West_A_1 |
SoilCO2_West_B_1 |
SoilCO2_West_C_1 |
Tower_2 |
Floor_South_2 |
Floor_West_2 |
Soil_Transect_4_2 |
Soil_Transect_3_2 |
Soil_Transect_2_2 |
Soil_Transect_1_2 |
SoilCO2_West_A_2 |
SoilCO2_West_B_2 |
SoilCO2_West_C_2 |
Tower_3 |
Floor_South_3 |
Floor_West_3 |
Soil_Transect_4_3 |
Soil_Transect_3_3 |
Soil_Transect_1_3 |
SoilCO2_West_A_3 |
SoilCO2_West_B_3 |
SoilCO2_West_C_3 |
Tower_4 |
Floor_South_4 |
Floor_West_4 |
Soil_Transect_4_4 |
Soil_Transect_3_4 |
Soil_Transect_2_4 |
Soil_Transect_1_4 |
SoilCO2_West_A_4 |
SoilCO2_West_B_4 |
SoilCO2_West_C_4 |
Soil_Transect_2_3 |
Avg | Spacial Count |
Measurement Count |
|---|---|---|---|---|---|---|---|---|---|---|---|---|---|---|---|---|---|---|---|---|---|---|---|---|---|---|---|---|---|---|---|---|---|---|---|---|---|---|---|---|---|---|---|---|---|---|
| 2020-02-12 | 43 | 0 | nan | 20.6 | 10.9 | 18.5 | 15 | 14.4 | 28.5 | 19.7 | 31.1 | 25 | 17.1 | 24.3 | 24 | 29.8 | 21 | 30.1 | 27.1 | 16.1 | 25.5 | 17 | 28 | 25.4 | 31.5 | 34.9 | 24.3 | 31.3 | 30.7 | 33.8 | 32.9 | 35.4 | 35.4 | 14.5 | 45.7 | 28.2 | 40.8 | 45.4 | 30.2 | 43.4 | 48.6 | 47.4 | ||||
| 2020-02-12 | 43 | 1 | nan | 21.4 | 10.9 | 21.7 | 15.6 | 13.8 | 28.2 | 20.9 | 30.2 | 24.1 | 17.6 | 23.1 | 23.7 | 28 | 21 | 29.8 | 27.4 | 15.5 | 24.3 | 15.8 | 28.9 | 26.8 | 31.3 | 33.5 | 24.6 | 31.3 | 30.1 | 33.8 | 32.4 | 36.3 | 35.4 | 14.8 | 29.1 | 41.1 | 45.4 | 29.1 | 43.1 | 48 | 47.7 | 38.5 | ||||
| 2020-02-12 | 43 | 2 | nan | 21.4 | 25.3 | 28.6 | 26.8 | 34.6 | 42.3 | 45.7 | 31.9 | |||||||||||||||||||||||||||||||||||
| 2020-02-12 | 43 | 3 | nan | 21.2 | 26.8 | 28 | 40.5 | 34.3 | 45.1 | 46.6 | ||||||||||||||||||||||||||||||||||||
| 2020-02-12 | 43 | 4 | nan | 27 | 27.4 | 49.1 | 38 | |||||||||||||||||||||||||||||||||||||||
| 2020-02-12 | 43 | Avg | 0-15cm | 0 | 0 | |||||||||||||||||||||||||||||||||||||||||
| 2020-02-12 | 43 | Avg | 15-30cm | 0 | 0 | |||||||||||||||||||||||||||||||||||||||||
| 2020-02-12 | 43 | Avg | 30-45cm | 0 | 0 | |||||||||||||||||||||||||||||||||||||||||
| 2020-02-12 | 43 | Avg | 45-60cm | 0 | 0 |
mode = both
Moisture Point Probes VR
Array
(
[0] => Flux_Tower_1
[1] => Biomass_Cage_1
[2] => Flux_Tower_2
[3] => Biomass_Cage_2
[4] => Flux_Tower_3
[5] => Biomass_Cage_3
[6] => Flux_Tower_4
[7] => Biomass_Cage_4
)
| Date | DOY | Rep | Depth | Flux_Tower_1 |
Biomass_Cage_1 |
Flux_Tower_2 |
Biomass_Cage_2 |
Flux_Tower_3 |
Biomass_Cage_3 |
Flux_Tower_4 |
Biomass_Cage_4 |
Avg | Spacial Count |
Measurement Count |
|---|---|---|---|---|---|---|---|---|---|---|---|---|---|---|
| 2020-02-12 | 43 | 0 | nan | 17.3 | 7.7 | 28.3 | 17.3 | 14.5 | 26.8 | 28.2 | 29.4 | |||
| 2020-02-12 | 43 | 1 | nan | 17.6 | 7.7 | 28.3 | 17.6 | 14.8 | 26 | 27.1 | 28.2 | |||
| 2020-02-12 | 43 | Avg | 0-15cm | 0 | 0 | |||||||||
| 2020-02-12 | 43 | Avg | 15-30cm | 0 | 0 | |||||||||
| 2020-02-12 | 43 | Avg | 30-45cm | 0 | 0 | |||||||||
| 2020-02-12 | 43 | Avg | 45-60cm | 0 | 0 |
No TZ grass heigth found
No VR grass heigth found
No VR Tree DBH found
No water potential data found
No VR Grass Biomass data found
No VR OakLeaves Biomass data found
No VR PineNeedles Biomass data found
2 photos found
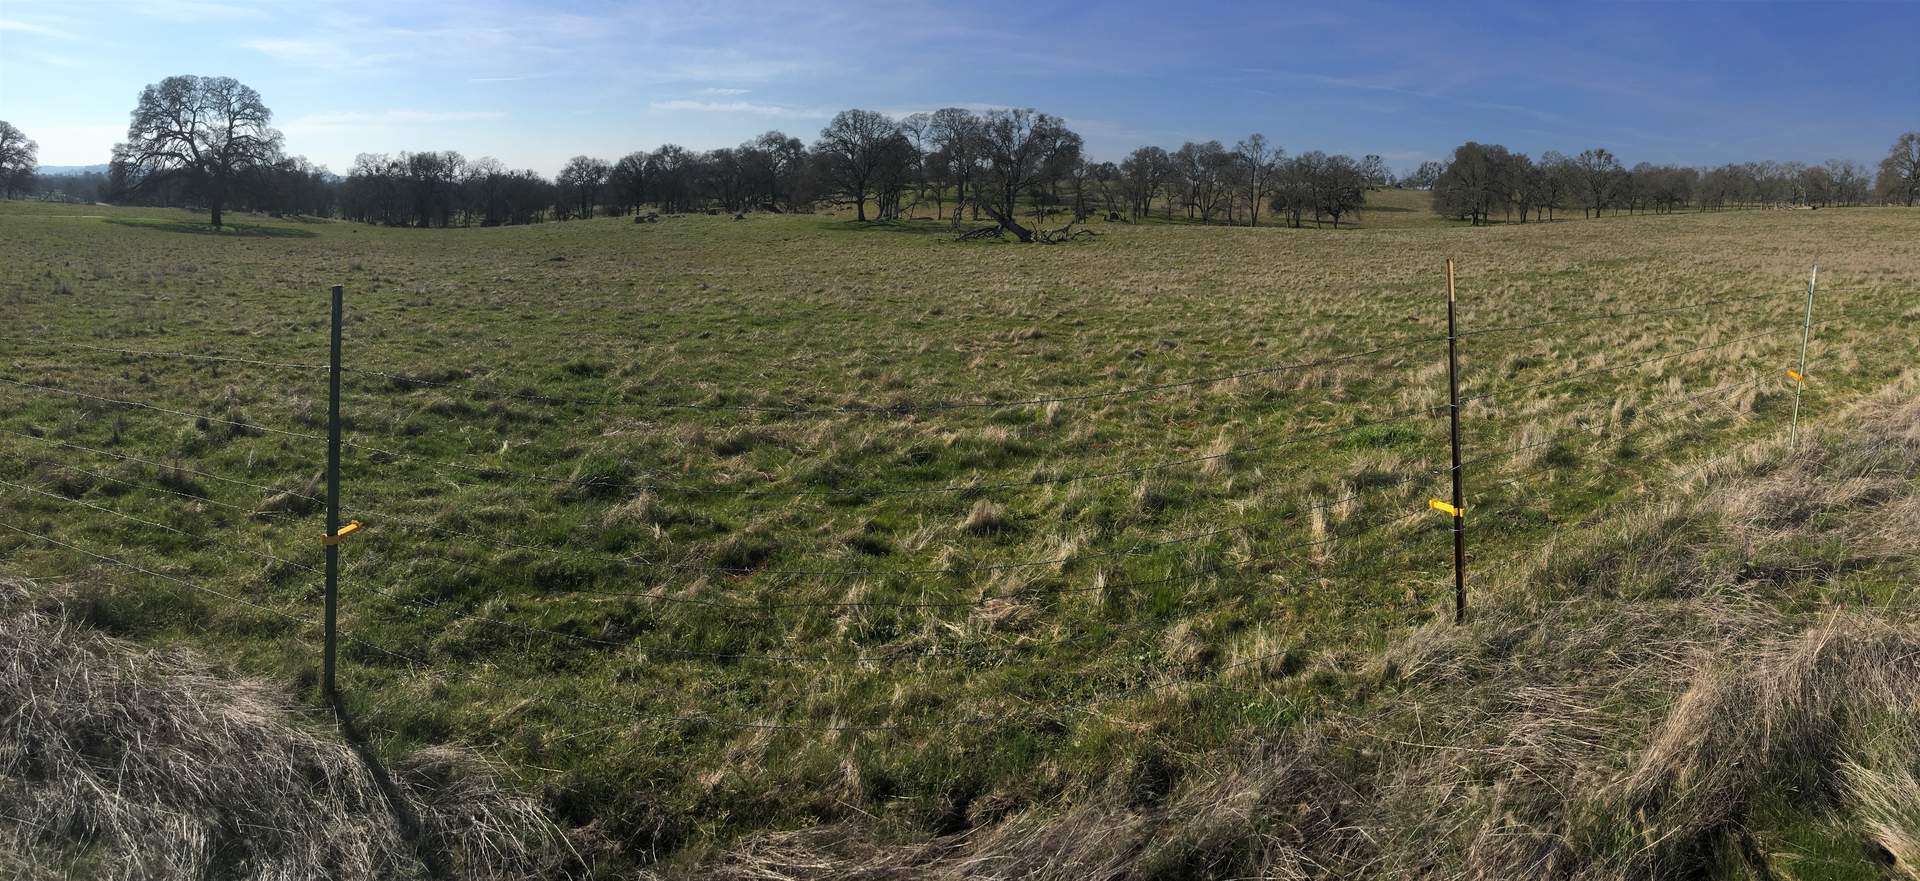
20200212VR_panorama.jpg ( 2020-02-12 14:08:43 ) Full size: 1920x881
Panorama of a spring-like day with green grass overtaking previous litter cover

20200212VR_WaterHole.jpg ( 2020-02-12 00:00:00 ) Full size: 1920x1440
Dry winter at Vaira
9 sets found
16 VR_met graphs found
2 VR_flux graphs found
6 VR_soilco2 graphs found
2 VR_pond graphs found
Can't check TZVR_mixed
No data found for VR_fd.
No data found for VR_processed.
4 VR_arable graphs found
No data found for VR_soilvue.