
Field Notes
<--2020-01-08 10:00:00 | 2020-02-12 12:00:00-->Other sites visited today: Vaira
Phenocam link: Searching...
Tonzi: 2020-01-28 11:30:00 (DOY 28)
Author: Joe Verfaillie
Others: Daphne
Summary: Standard fieldwork, updated Tower met program to try to fix spikes in reflected PAR.
| Tonzi 2020-01-28 Daphne and I arrived at about 11:30. It was mostly overcast with patches of light rain and sun. The ground is wet but not soggy and there are large puddles on the road. The pond level has not come up much though. The grass here is sparser than at Vaira and many of the tips have yellowed – frost damage? I downloaded data from the towers and other data loggers. At the Tower top I moved the two PAR sensors down two slots on the multiplexer because there have been spikes in the reflected PAR. A new program was loaded. I downloaded the FD chambers and cleared their memories. I serviced the z-cams. I checked the images on z-cam 1 and it seemed to be working properly. It is now driven by the CR6 controlling the CO2 profile instead of the original CR10x. Daphne did the soil moisture, manual well measurements, and dendrometers. She also collect some more soil for Miriam and Ana’s emissivity project. However there was a puddle where Ana indicated they got the soil last time so this batch it from a spot a little farther to the west. |
Field Data
No tank data
Well Depth
| Date | Location | Depth (feet) |
|---|---|---|
| 2020-01-28 | VR_well | 58.33 |
| 2020-01-28 | VR_pond | 17.44 |
| 2020-01-28 | TZ_floor | 29.7 |
| 2020-01-28 | TZ_tower | 34.56 |
| 2020-01-28 | TZ_road | 37.99 |
mode = both
Moisture Point Probes TZ
Array
(
[0] => Tower_1
[1] => Floor_South_1
[2] => Floor_West_1
[3] => Soil_Transect_4_1
[4] => Soil_Transect_3_1
[5] => Soil_Transect_2_1
[6] => Soil_Transect_1_1
[7] => SoilCO2_West_A_1
[8] => SoilCO2_West_B_1
[9] => SoilCO2_West_C_1
[10] => Tower_2
[11] => Floor_South_2
[12] => Floor_West_2
[13] => Soil_Transect_4_2
[14] => Soil_Transect_3_2
[15] => Soil_Transect_2_2
[16] => Soil_Transect_1_2
[17] => SoilCO2_West_A_2
[18] => SoilCO2_West_B_2
[19] => SoilCO2_West_C_2
[20] => Tower_3
[21] => Floor_South_3
[22] => Floor_West_3
[23] => Soil_Transect_4_3
[24] => Soil_Transect_3_3
[25] => Soil_Transect_2_3
[26] => Soil_Transect_1_3
[27] => SoilCO2_West_A_3
[28] => SoilCO2_West_B_3
[29] => SoilCO2_West_C_3
[30] => Tower_4
[31] => Floor_South_4
[32] => Soil_Transect_4_4
[33] => Soil_Transect_3_4
[34] => Soil_Transect_2_4
[35] => Soil_Transect_1_4
[36] => SoilCO2_West_A_4
[37] => SoilCO2_West_B_4
[38] => SoilCO2_West_C_4
)
| Date | DOY | Rep | Depth | Tower_1 |
Floor_South_1 |
Floor_West_1 |
Soil_Transect_4_1 |
Soil_Transect_3_1 |
Soil_Transect_2_1 |
Soil_Transect_1_1 |
SoilCO2_West_A_1 |
SoilCO2_West_B_1 |
SoilCO2_West_C_1 |
Tower_2 |
Floor_South_2 |
Floor_West_2 |
Soil_Transect_4_2 |
Soil_Transect_3_2 |
Soil_Transect_2_2 |
Soil_Transect_1_2 |
SoilCO2_West_A_2 |
SoilCO2_West_B_2 |
SoilCO2_West_C_2 |
Tower_3 |
Floor_South_3 |
Floor_West_3 |
Soil_Transect_4_3 |
Soil_Transect_3_3 |
Soil_Transect_2_3 |
Soil_Transect_1_3 |
SoilCO2_West_A_3 |
SoilCO2_West_B_3 |
SoilCO2_West_C_3 |
Tower_4 |
Floor_South_4 |
Soil_Transect_4_4 |
Soil_Transect_3_4 |
Soil_Transect_2_4 |
Soil_Transect_1_4 |
SoilCO2_West_A_4 |
SoilCO2_West_B_4 |
SoilCO2_West_C_4 |
Avg | Spacial Count |
Measurement Count |
|---|---|---|---|---|---|---|---|---|---|---|---|---|---|---|---|---|---|---|---|---|---|---|---|---|---|---|---|---|---|---|---|---|---|---|---|---|---|---|---|---|---|---|---|---|---|
| 2020-01-28 | 28 | 0 | nan | 29.9 | 19.7 | 26.7 | 21.7 | 26.1 | 26.7 | 23.8 | 33.2 | 27.6 | 17.1 | 25.5 | 26.5 | 31.3 | 27.1 | 32.6 | 33.8 | 18.8 | 28 | 20.6 | 30.1 | 26.8 | 32.4 | 34.6 | 33.2 | 34.1 | 33.5 | 31.3 | 36.8 | 38.2 | 39.1 | 34.8 | 15.6 | 35.7 | 44.3 | 47.4 | 34.8 | 45.4 | 53.4 | 48.3 | |||
| 2020-01-28 | 28 | 1 | nan | 29.4 | 19.4 | 26.7 | 20.9 | 25.8 | 27 | 32.9 | 27.9 | 16.5 | 24.9 | 25.8 | 31.3 | 26.8 | 32.6 | 32.9 | 18.2 | 28.9 | 21 | 31 | 25.4 | 31.8 | 36.8 | 33.2 | 33.8 | 35.4 | 32.1 | 37.4 | 38.5 | 39.6 | 34.8 | 15.3 | 33.7 | 44 | 48 | 35.4 | 46 | 50.9 | 48.3 | ||||
| 2020-01-28 | 28 | 2 | nan | 23.2 | 17.9 | 31.5 | 35.4 | ||||||||||||||||||||||||||||||||||||||
| 2020-01-28 | 28 | Avg | 0-15cm | 0 | 0 | ||||||||||||||||||||||||||||||||||||||||
| 2020-01-28 | 28 | Avg | 15-30cm | 0 | 0 | ||||||||||||||||||||||||||||||||||||||||
| 2020-01-28 | 28 | Avg | 30-45cm | 0 | 0 | ||||||||||||||||||||||||||||||||||||||||
| 2020-01-28 | 28 | Avg | 45-60cm | 0 | 0 |
mode = both
Moisture Point Probes VR
Array
(
[0] => Solar_Panels_1
[1] => Flux_Tower_1
[2] => Biomass_Cage_1
[3] => Solar_Panels_2
[4] => Flux_Tower_2
[5] => Biomass_Cage_2
[6] => Solar_Panels_3
[7] => Flux_Tower_3
[8] => Biomass_Cage_3
[9] => Solar_Panels_4
[10] => Flux_Tower_4
[11] => Biomass_Cage_4
)
| Date | DOY | Rep | Depth | Solar_Panels_1 |
Flux_Tower_1 |
Biomass_Cage_1 |
Solar_Panels_2 |
Flux_Tower_2 |
Biomass_Cage_2 |
Solar_Panels_3 |
Flux_Tower_3 |
Biomass_Cage_3 |
Solar_Panels_4 |
Flux_Tower_4 |
Biomass_Cage_4 |
Avg | Spacial Count |
Measurement Count |
|---|---|---|---|---|---|---|---|---|---|---|---|---|---|---|---|---|---|---|
| 2020-01-28 | 28 | 0 | nan | 30.2 | 18.5 | 14.7 | 28.3 | 31.9 | 23.7 | 36.6 | 18.2 | 31.8 | 43.1 | 30.8 | 33.1 | |||
| 2020-01-28 | 28 | 1 | nan | 28.8 | 17.9 | 13.8 | 28.6 | 31.9 | 24.3 | 32.1 | 18.2 | 32.4 | 43.4 | 30.2 | 33.7 | |||
| 2020-01-28 | 28 | Avg | 0-15cm | 0 | 0 | |||||||||||||
| 2020-01-28 | 28 | Avg | 15-30cm | 0 | 0 | |||||||||||||
| 2020-01-28 | 28 | Avg | 30-45cm | 0 | 0 | |||||||||||||
| 2020-01-28 | 28 | Avg | 45-60cm | 0 | 0 |
No TZ grass heigth found
No VR grass heigth found
Tree DBH
| Date | Tag# | Reading (mm) |
|---|---|---|
| 2020-01-28 | 1 | 21.9 |
| 2020-01-28 | 102 | 18.2 |
| 2020-01-28 | 2 | 20.9 |
| 2020-01-28 | 3 | 14.0 |
| 2020-01-28 | 4 | 6.4 |
| 2020-01-28 | 6 | 15.3 |
| 2020-01-28 | 7 | 18.8 |
| 2020-01-28 | 72 | 5.5 |
| 2020-01-28 | 79 | 19.3 |
| 2020-01-28 | 8 | 6.2 |
No water potential data found
No TZ Grass Biomass data found
No TZ OakLeaves Biomass data found
No TZ PineNeedles Biomass data found
1 photos found
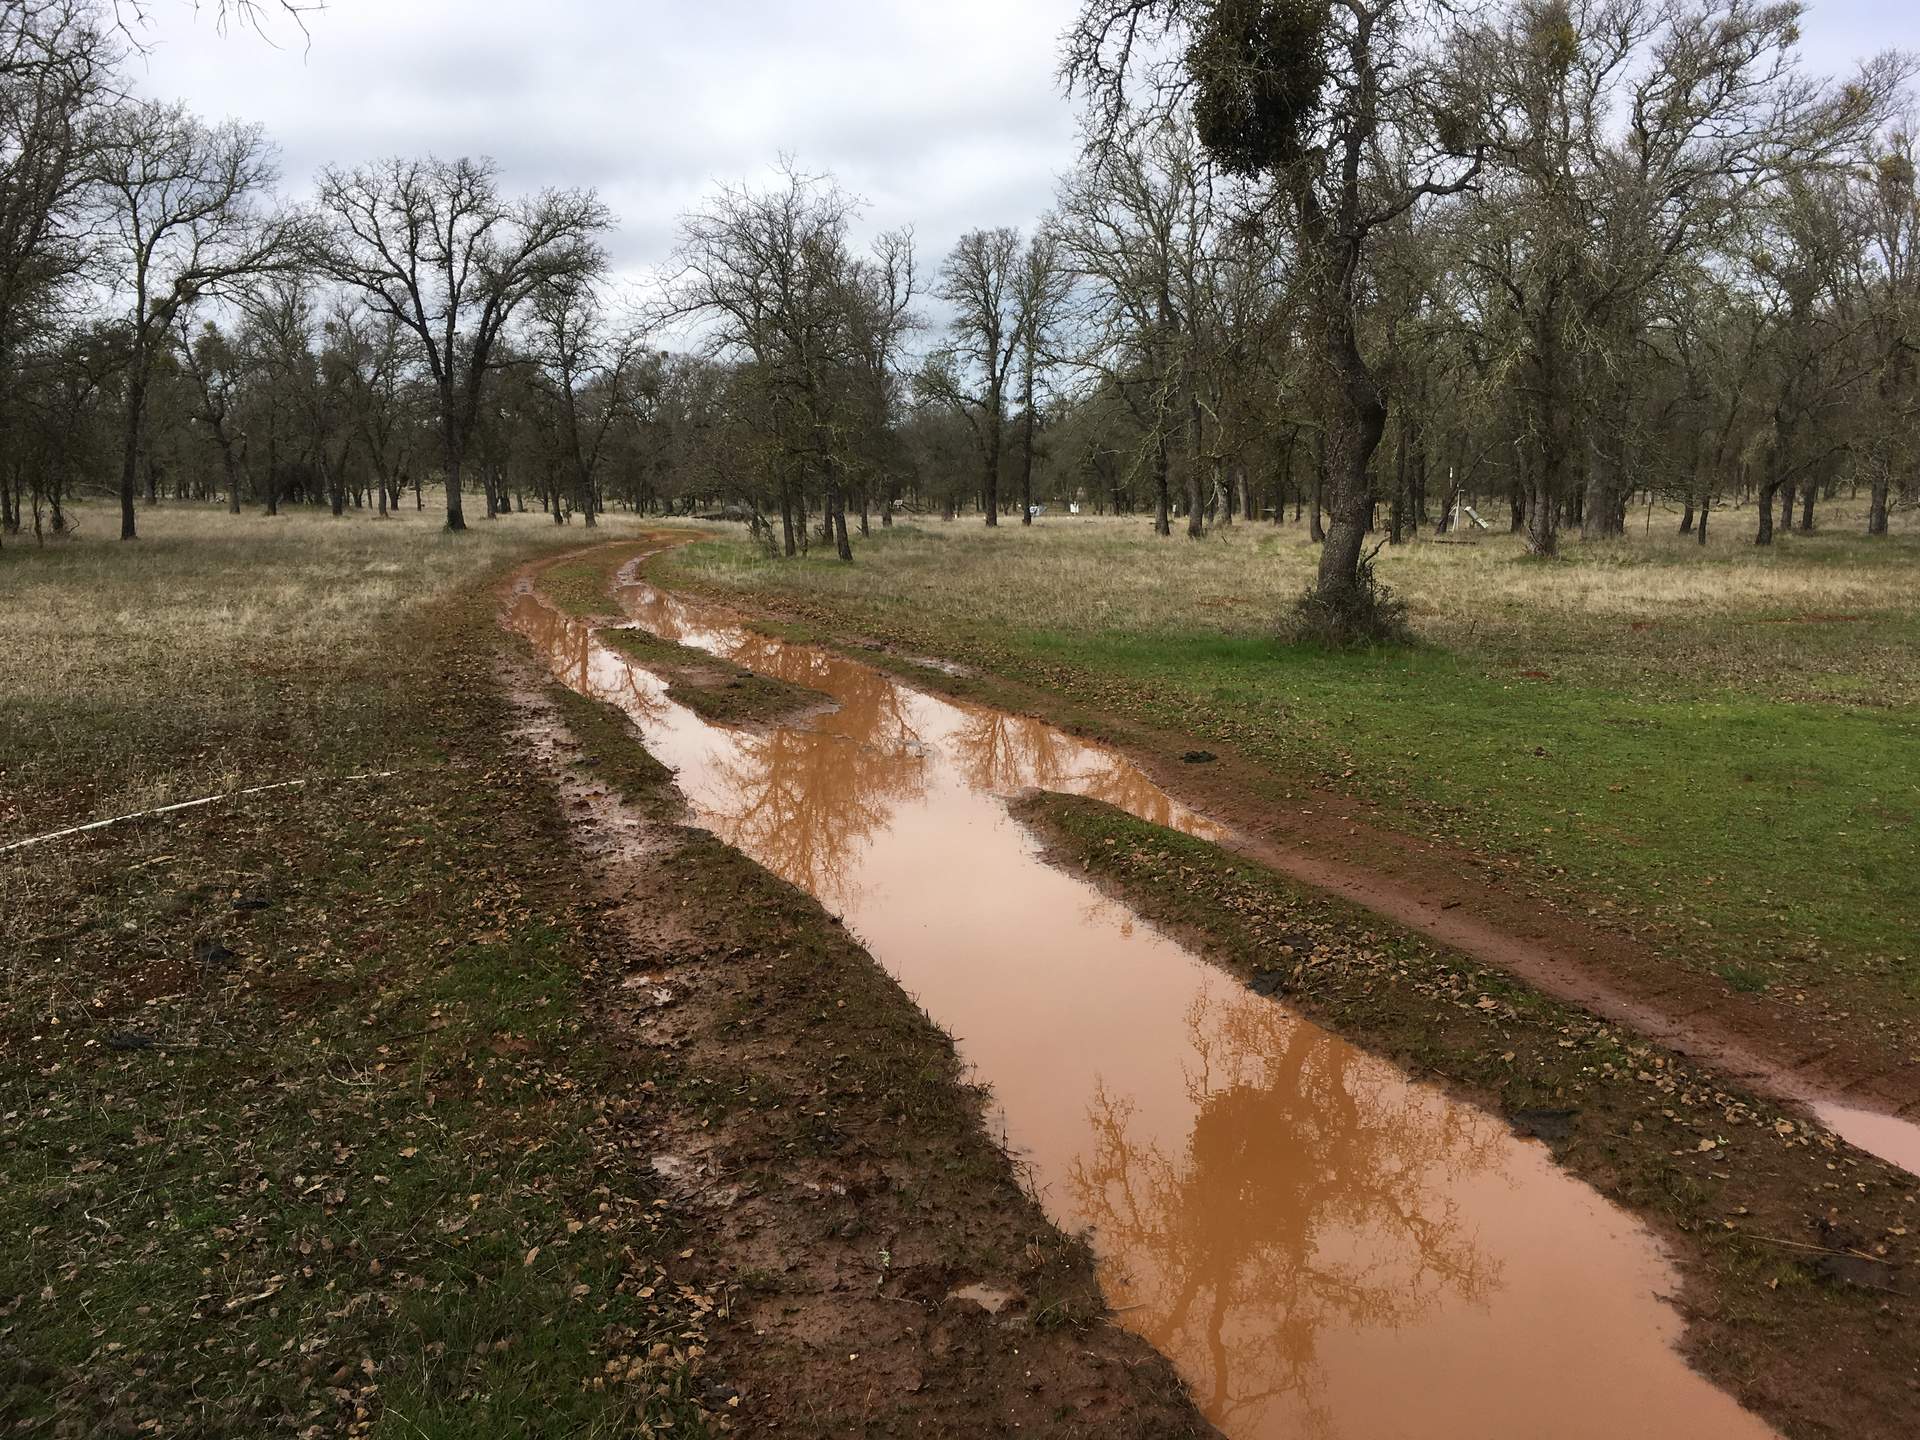
20200128TZ_RoadPuddles.jpg ( 2020-01-28 00:00:00 ) Full size: 1920x1440
Puddles on the road
16 sets found
No data found for TZ_Fenergy.
11 TZ_tmet graphs found
11 TZ_soilco2 graphs found
Can't check TZ_mixed
3 TZ_mixed graphs found
1 TZ_fflux graphs found
8 TZ_fmet graphs found
No data found for TZ_tram.
3 TZ_co2prof graphs found
1 TZ_irt graphs found
No data found for TZ_windprof.
1 TZ_tflux graphs found
2 TZ_sm graphs found
Can't check TZ_met
1 TZ_met graphs found
Can't check TZVR_mixed
8 TZ_osu graphs found
3 TZ_fd graphs found
Tonzi Z-cam data