Field Notes
<--2019-01-03 10:45:00 | 2019-01-24 11:15:00-->Other sites visited today: Sherman Barn | Sherman Wetland | West Pond | Bouldin Alfalfa | Bouldin Corn | East End | East Pond | Sherman Wetland
Phenocam link: Searching...
Mayberry: 2019-01-18 10:55:00 (DOY 18)
Author: Daphne Szutu
Others: Dennis, Kuno, Camilo, Jiangong
Summary: Regular data downloading/cleaning, swapped 7500 for calibration, CR1000 hung up again, replaced HMP fan wire/screw terminal, left HMP and NDVI sensors disconnected
| 2019-01-18 Mayberry Dennis, Kuno, Camilo, Jiangong, and I arrived at 10:55. It was overcast, mild, and calm. The wetland is brown and has been blown down. I forgot to write down the water level, but it looked a bit higher than last time. Jiangong collected water samples for Isabel at 11:10. Kuno cleaned flux and rad sensors. The HMP fan wasn’t working. The wire between the fan and the screw terminal was corroded; Kuno stripped it back and replaced the screw terminal. Camilo also re-wired the fan wire in the power junction box. The wash reservoir was ¾ empty; we refilled it. I couldn’t connect to the datalogger, and didn’t hear the mux clicking, even though the datalogger had power. Camilo and Jiangong observed a puff of smoke coming from some spliced wires when we first got to the tower, from either the HMP AirT/RH or the NDVI sensors. I tried power cycling the datalogger, but that didn’t seem to change anything. I left it unplugged while we repaired the HMP fan. When I plugged it in again, the datalogger started up successfully. I’m not sure what the issue was, but I left the HMP and NDVI sensors unplugged for now. After I connected to the datalogger, I collected met, camera, and USB GHG data. We swapped the LI-7500 for calibration: sn 1594 came down and sn 75H-2514 went up. I uploaded a new configuration file, updated the pressure coefficients, and reset the box. I checked that the 7500 and 7700 were both connected, the USB stick was logging, and that the GHG columns looked good. LI-7500 readings (sn 1594 --> sn 75H-2514): CO2 417ppm --> 418 H2O 530ppm --> 466 T 15.3C --> 15.8 P 102.6kPa --> 102 SS 102--> 101 after cleaning --> ?? LI7700 readings: CH4 2.1ppm RSSI 49 --> 79 after cleaning We left at 11:45. |
1 photos found

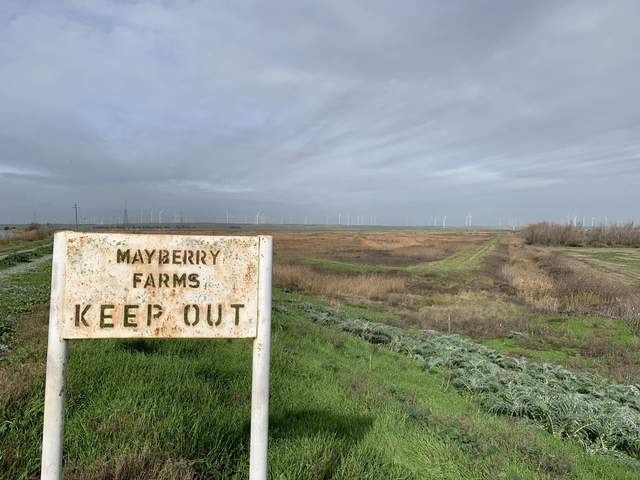
20190118MB_MbSign.jpg ( 2019-01-18 00:00:00 ) Full size: 1920x1440
Entrance to Mayberry with brown tule blowdown in the background.
11 sets found
7 MB_flux graphs found
No data found for MB_met.
28 MB_tule graphs found
Can't check MBWPEESWGT_mixed
1 MB_cam graphs found
Can't check MBEEWPSWEPGT_cam
Can't check SIMBTWEE_met
1 MB_minidot graphs found
Can't check MBSWEEWPBCBA
1 MB_processed graphs found
Can't check MB_fd
1 MB_fd graphs found

