Field Notes
<--2018-12-18 11:05:00 | 2019-01-18 10:55:00-->Other sites visited today: Bouldin Alfalfa | Bouldin Corn | East End | East Pond | Sherman Barn | Sherman Wetland | West Pond
Phenocam link: Searching...
Mayberry: 2019-01-03 10:45:00 (DOY 3)
Author: Daphne Szutu
Others: Joe
Summary: Regular data collection/cleaning, boom blown by wind, no met data 12/24-1/3
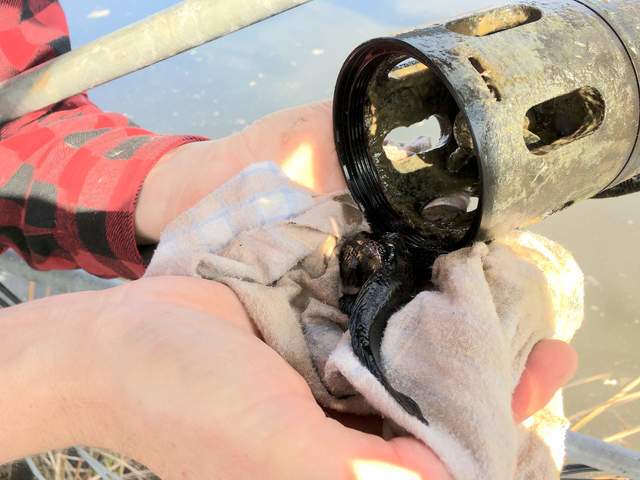
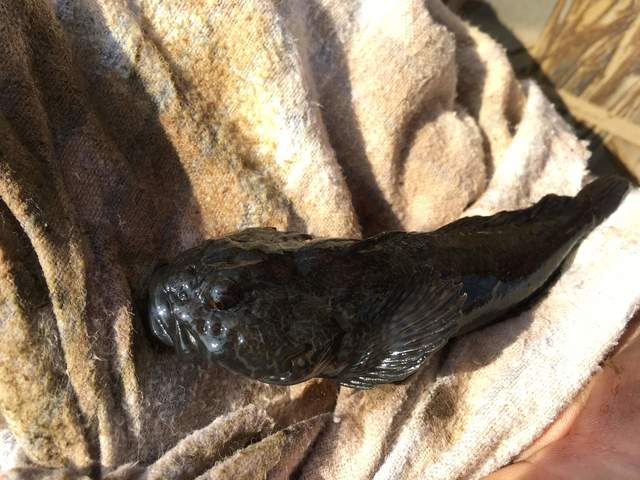
| 2019-01-03 Mayberry Joe and I arrived at 10:45. It was cold and calm, mostly cloudy with wispy clouds. When we arrived, the upper boardwalk and one of the lower boardwalk (under the met box) had been blown from the north side to the south side of the tower. The floating boom had been blown to point E. Joe adjusted the boom so that it again faces N. The water is brown and full of cattail fluff clumps, some which seem to be growing algae (greenish). The water (or at least the surface of the water) was flowing east. The water level was 36 cm. Joe collected water samples for Isabel around 10:45 PST before he got in the water. I downloaded met, camera, USB GHG, and miniDOT data. The mux was not clicking when we arrived. I power-cycled the data logger, after which the mux started up again. There was no met data after 2018-12-14; the data logger may have gotten hung up on something. The GHG data has a lot of breaks on 2018-12-14 between 19:00 and 23:00, which may be related. Joe cleaned the fluorometer and discovered a small dark gray fish inside (there’s been a fish inside the previous ~2 times we cleaned the fluorometer as well). The fluorometer is very gunky and might benefit from new brushes. Joe reattached the power junction box securely to the tower. We refilled the wash reservoir, which was mostly full, and replaced the batteries for the top miniDOT. We left mothballs in the power junction box, the met box and the solar controller box which had ants in it. LI-7500 readings: CO2 446ppm H2O 340ppm T 9.6C P 102.5kPa SS 102--> 103 after cleaning LI7700 readings: CH4 2.4ppm RSSI 50--> 79 after cleaning We left at 11:40. |
2 photos found

20190103MB_FishInFluorometer.jpg ( 2019-01-03 11:21:53 ) Full size: 1920x1440
A fish has been living it the fluorometer.

20190103MB_SculpinMaybe.jpg ( 2019-01-03 11:22:33 ) Full size: 1920x1440
Maybe a type of sculpin living it the fluorometer
11 sets found
7 MB_flux graphs found
No data found for MB_met.
28 MB_tule graphs found
Can't check MBWPEESWGT_mixed
1 MB_cam graphs found
Can't check MBEEWPSWEPGT_cam
Can't check SIMBTWEE_met
1 MB_minidot graphs found
Can't check MBSWEEWPBCBA
1 MB_processed graphs found
Can't check MB_fd
1 MB_fd graphs found

