Field Notes

<--2018-05-03 09:15:00 | 2018-05-10 10:30:00-->
Other sites visited today: Sherman Wetland | East Pond | Twitchell Alfalfa | West Pond | Sherman Barn

Sherman Wetland: 2018-05-10 10:15:00 (DOY 130)
Author: Patty Oikawa
Others:

Summary: Downloaded LGR data, changed filters on inlets

nice clear sunny day, lots of wind, ran into Joe
Cal tank psi=1500, (look like its going through 200psi every 1.5 mo)
New strap working well but tarp needs replacing
Still haven’t replaced Dryrite, but the bulk of it is still blue and H20 looks normal so maybe ok for now
Downloaded data 3/26-5/9
Lowest inlet filter looked fine, but I swapped out the 3m and 5m inlets. The top one looked fairly dirty, but values didn’t change much after swap.

Readings:
CO2 421.6ppm
D13C -13.01 per mil
D18O = -51.1 per mil
H2O = 280.0ppm
Gas Temp=44.83C
Gas Pressure = 119.78 Torr
Laser response = 12.85 us

1 photos found

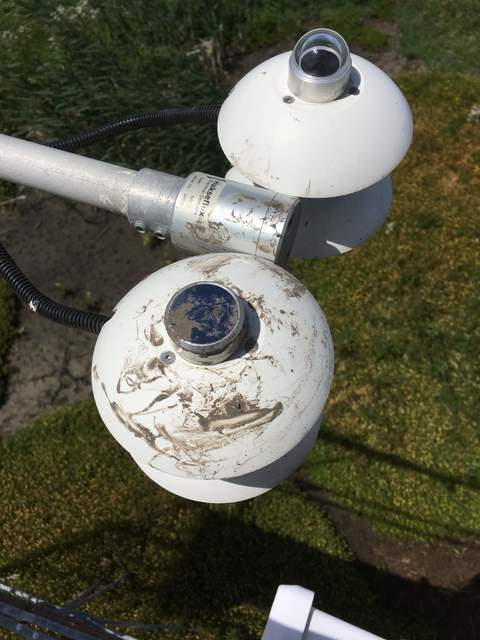
view of field site
20180510SW_DirtyLongwaveIn.jpg ( 2018-05-10 11:38:52 ) Full size: 1440x1920
view of field site

Graphs display:
7 sets found

Can't check MBWPEESWGT_mixed
Can't check MBEEWPSWEPGT_cam
15 SW_met graphs found

Explore the graph:Temperatures in a new window

Explore the graph:Water Temperature Profile A in a new window

Explore the graph:Water Temperature Profile B in a new window

Explore the graph:Soil Temperature Profile C2 in a new window

Explore the graph:Soil Heat Flux in a new window

Explore the graph:Four channel Radiometer in a new window

Explore the graph:Sherman Wetland PAR in a new window

Explore the graph:PRI Channels in a new window

Explore the graph:NDVI Channels in a new window

Explore the graph:Water level and Rain in a new window

Explore the graph:Dissolved CO2 in a new window

Explore the graph:Air Pressure in a new window

Explore the graph:Battery Voltage and RH in a new window

Explore the graph:Soil Temperature Profile C1 in a new window

Explore the graph:SRS NDVI and PRI in a new window

4 SW_flux graphs found

Explore the graph:CO2 and H2O in a new window

Explore the graph:Wind in a new window

Explore the graph:Methane in a new window

Explore the graph:Data Counts in a new window

Can't check MBSWEEWPBCBA
Can't check SW_Temp
14 SW_Temp graphs found

Explore the graph:Temperatures in a new window

Explore the graph:CO2 and H2O in a new window

Explore the graph:Wind in a new window

Explore the graph:Methane in a new window

Explore the graph:Data Counts in a new window

Explore the graph:Temperature Profile A in a new window

Explore the graph:Temperature Profile B in a new window

Explore the graph:Temperature Profile C in a new window

Explore the graph:Soil Heat Flux in a new window

Explore the graph:Four-channel radiometer in a new window

Explore the graph:NDVI Channels in a new window

Explore the graph:PAR in a new window

Explore the graph:Air Pressure and Water Level in a new window

Explore the graph:Air T and RH in a new window

No data found for SW_arable.