Field Notes
<--2018-05-10 10:15:00 | 2018-05-16 14:35:00-->Other sites visited today: Sherman Wetland | East Pond | Twitchell Alfalfa | West Pond | Sherman Barn
Phenocam link: Searching...
Sherman Wetland: 2018-05-10 10:30:00 (DOY 130)
Author: Joe Verfaillie
Others:
Summary: Swapped 7700, upgrade CR1000 os, water level low, installed USB miniDOT
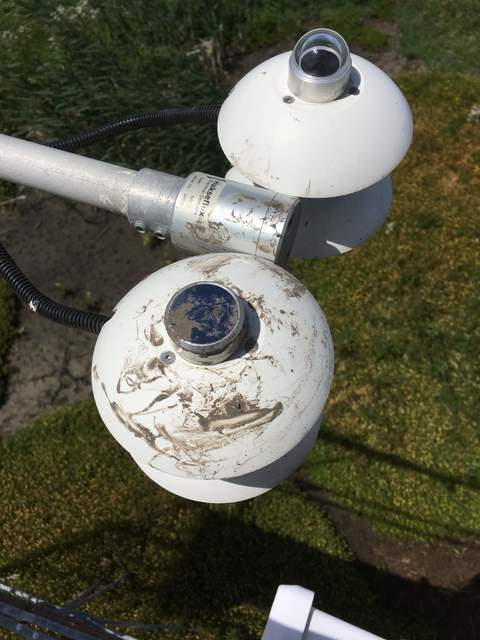
| Sherman Wetland 2018-05-10 I arrived at about 10:30. Patty had just arrived and was still sitting in her car. It was cool and windy with high thin clouds. The water level is low with ground showing in many places. The Eos CO2 sensor was just barely in the water and the conductivity sensor was high and dry. I swapped the 7700 sn TG1-0421 off: 1.96ppm CH4, 67.2RSSI – 79.9 after cleaning sn TG1-0423 on: 1.94ppm CH4, 69.5RSSI After the swap, the clocks were about 10min ahead. I set the 7700 clock from 10:15 to 10:06. I did not check the wash reservoir. The 7500 read: 401ppm CO2, 693mmol/m3 H2O, 18.8C, 101.4kPa, 99.8SS I downloaded the met data and ejected the card before I updated the CR1000 sn 38211 OS from v27 to v32.02. This completely reset its configuration to default settings. I reloaded the program. There were two versions on the laptop 20170714 and 20170814. The 20170714 program had a newer modification date and the other program had two output tables in it. I opted for the 20170714 version. I also had to adjust its ftp settings. I cleaned the radiometers. The longwave in was very dirty. I was planning to put in a new USB miniDOT to measure DO, but because the water level was so low I hesitated. Finally, I put in sn 906606 on a rope two posts south of the tower along the board walk. |
1 photos found

20180510SW_DirtyLongwaveIn.jpg ( 2018-05-10 11:38:52 ) Full size: 1440x1920
Muddy LWin sensor
7 sets found
Can't check MBWPEESWGT_mixed
Can't check MBEEWPSWEPGT_cam
15 SW_met graphs found
4 SW_flux graphs found
Can't check MBSWEEWPBCBA
Can't check SW_Temp
14 SW_Temp graphs found
No data found for SW_arable.

