
Field Notes
<--2018-01-31 09:30:00 | 2018-02-28 11:40:00-->Other sites visited today: Bouldin Alfalfa | Bouldin Corn | Mayberry | Sherman Wetland | West Pond | East End
Phenocam link: Searching...
Twitchell Alfalfa: 2018-02-13 11:10:00 (DOY 44)
Author: Daphne Szutu
Others: Joe, Sam, Alex Valach, Tim Lu
Summary: Regular data collection/cleaning, soil respiration, veg height, moved difPAR to CR10x to fix precip under-measurement problem
| 2018-02-13 Twitchell Alfalfa We arrived at 11:10. It was clear, sunny, and cool. It was also breezy and there was good visibility. We could see some smoke from burning on Staten Island. The field is greening up and the nettles are coming back up, but alfalfa is less than 50% of the cover. Tim collected veg height data. Sam did soil respiration and cleaned the rad sensors. Alex glued bird spikes on the camera. I downloaded met, soilCO2, camera, and USB GHG data. I also cleaned the 7500. LI-7500 readings: CO2 390ppm H2O 370ppm T 14.8C P 102.4 kPa SS 98 --> 103 after cleaning Joe moved the difPAR from the CR1000 to CR10x sn 48042, which should fix the precipitation measurement. When the difPAR was on the CR1000, the precipitation was under-measured: the precipitation pulse measurement had to be on the fast scan (500 mSec frequency) rather than the slowsequence (10 Sec frequency), so out of every 10 sec interval, we were only capturing the first 0.5 sec of precipitation. We uploaded a new program to the met CR1000, AlfalfaTowerMet_20180213.CR1. We left at 11:55. |
1 photos found
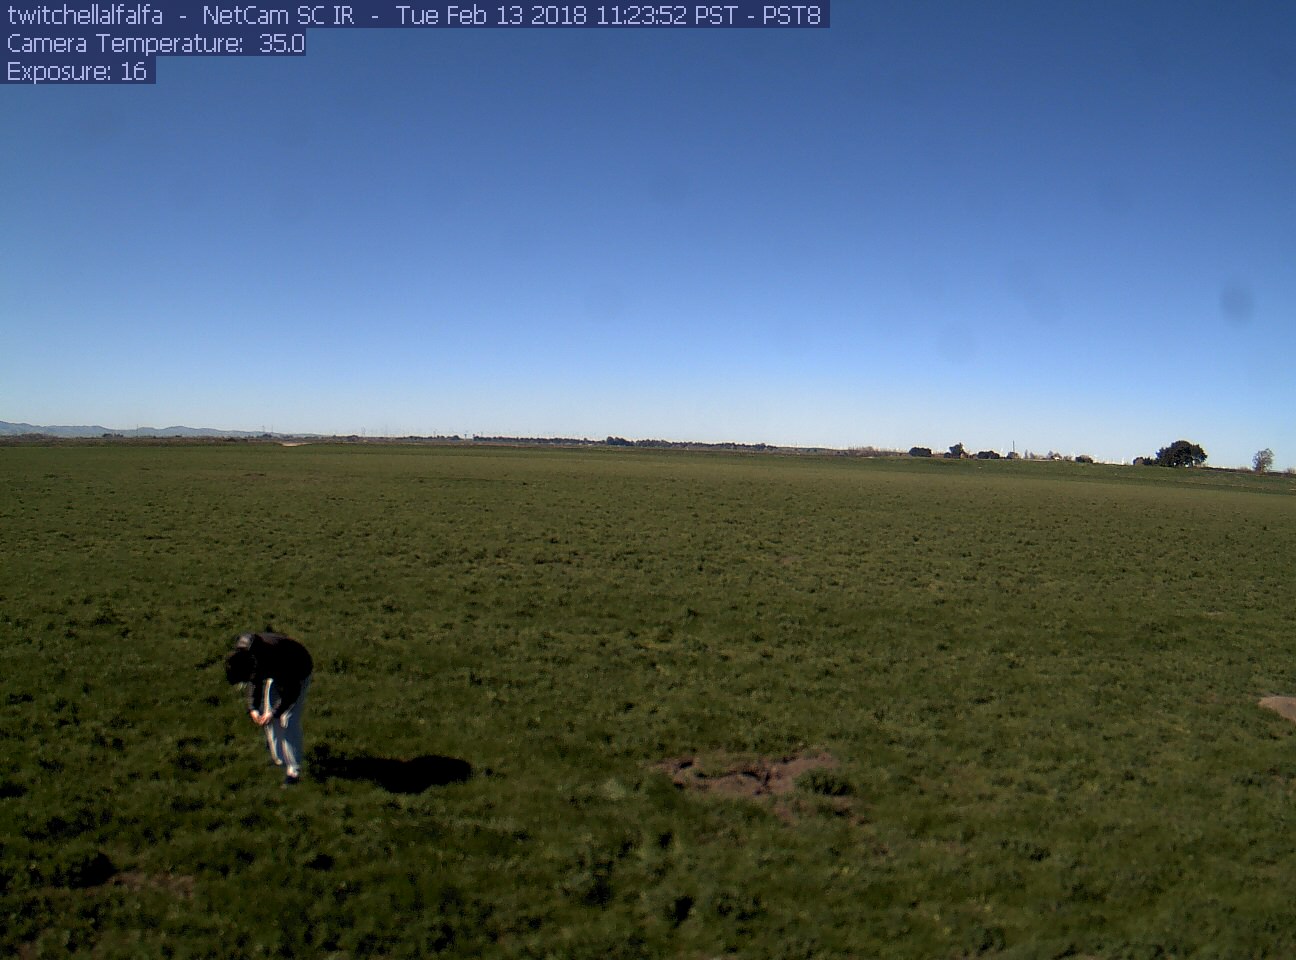
twitchellalfalfa_2018_02_13_112352.jpg ( 2018-02-13 11:24:28 ) Full size: 1296x960
Tim doing veg height
7 sets found
Can't check TA_met
11 TA_met graphs found
Can't check TA_rad
3 TA_rad graphs found
Can't check TA_flux
5 TA_flux graphs found
Can't check TA_soilco2
7 TA_soilco2 graphs found
1 TA_arable graphs found
1 TA_cam graphs found
Can't check TATWBABCSB_cam