
Field Notes
<--2017-12-14 10:00:00 | 2018-01-15 10:30:00-->Other sites visited today: Tonzi | Tonzi
Phenocam link: Searching...
Vaira: 2018-01-03 09:00:00 (DOY 3)
Author: Joe Verfaillie
Others: Siyan
Summary: Cow(s) got inside the fence, standard fieldwork, went to the pond.
| Vaira 2018-01-03 I arrived at about 9:00 with Siyan. It was cool with a thin overcast and little to no wind. Rain is coming later today. The soil and grass seem damp due to dew. There is some water in the water hole but no puddles on the road. At least one cow got inside the fence. There were a couple of cow pies and the grass was generally trampled and cropped. Nothing seemed chewed but the experimental TCs that I put into the East soil CO2 profile were pulled out. The electric fence line was tangled with the barbwire in a couple of places. The barbed wire in the northeast corner was a little loose and spread apart. I tried to tighten it up but needed heavier pliers. I collected the data and reinstalled the experimental TCs while Siyan did the standard fieldwork including clip plots. The computer had not been sending data because Loggernet was not running. Restarting Loggernet fixed it. The experiment TCs are on the multiplexor and have the voltage divider on them so their calculated degrees C is wrong. I’ll have to back out the type-T conversion and adjust the mV for the voltage divider and redo the conversion to make the data useful. I collected the FD Chamber data. I did not clear the data or check for new sprouts inside. The chambers will likely be removed soon. We went to the pond to collect data. The staff gauge read 15.65ft. There were lots of hungry cows that boxed us in both coming and going to the pond. There are bunch of young cows that might account for the trespassing through our fence. |
Field Data
No tank data
Well Depth
| Date | Location | Depth (feet) |
|---|---|---|
| 2018-01-03 | TZ_floor | 29 |
| 2018-01-03 | TZ_road | 37.6 |
| 2018-01-03 | TZ_tower | 34 |
| 2018-01-03 | VR_pond | 15.65 |
| 2018-01-03 | VR | 15.65 |
mode = both
Moisture Point Probes TZ
Array
(
[0] => Tower_1
[1] => Floor_South_1
[2] => Floor_East_1
[3] => Floor_West_1
[4] => Soil_Transect_4_1
[5] => Soil_Transect_3_1
[6] => Soil_Transect_2_1
[7] => Soil_Transect_1_1
[8] => SoilCO2_West_A_1
[9] => SoilCO2_West_B_1
[10] => SoilCO2_West_C_1
[11] => Tower_2
[12] => Floor_South_2
[13] => Floor_East_2
[14] => Floor_West_2
[15] => Soil_Transect_4_2
[16] => Soil_Transect_3_2
[17] => Soil_Transect_2_2
[18] => Soil_Transect_1_2
[19] => SoilCO2_West_A_2
[20] => SoilCO2_West_B_2
[21] => SoilCO2_West_C_2
[22] => Tower_3
[23] => Floor_South_3
[24] => Floor_East_3
[25] => Floor_West_3
[26] => Soil_Transect_4_3
[27] => Soil_Transect_3_3
[28] => Soil_Transect_2_3
[29] => Soil_Transect_1_3
[30] => SoilCO2_West_A_3
[31] => SoilCO2_West_B_3
[32] => SoilCO2_West_C_3
[33] => Tower_4
[34] => Floor_South_4
[35] => Floor_West_4
[36] => Soil_Transect_4_4
[37] => Soil_Transect_3_4
[38] => Soil_Transect_2_4
[39] => Soil_Transect_1_4
[40] => SoilCO2_West_A_4
[41] => SoilCO2_West_B_4
[42] => SoilCO2_West_C_4
[43] => Floor_East_4
)
| Date | DOY | Rep | Depth | Tower_1 |
Floor_South_1 |
Floor_East_1 |
Floor_West_1 |
Soil_Transect_4_1 |
Soil_Transect_3_1 |
Soil_Transect_2_1 |
Soil_Transect_1_1 |
SoilCO2_West_A_1 |
SoilCO2_West_B_1 |
SoilCO2_West_C_1 |
Tower_2 |
Floor_South_2 |
Floor_East_2 |
Floor_West_2 |
Soil_Transect_4_2 |
Soil_Transect_3_2 |
Soil_Transect_2_2 |
Soil_Transect_1_2 |
SoilCO2_West_A_2 |
SoilCO2_West_B_2 |
SoilCO2_West_C_2 |
Tower_3 |
Floor_South_3 |
Floor_East_3 |
Floor_West_3 |
Soil_Transect_4_3 |
Soil_Transect_3_3 |
Soil_Transect_2_3 |
Soil_Transect_1_3 |
SoilCO2_West_A_3 |
SoilCO2_West_B_3 |
SoilCO2_West_C_3 |
Tower_4 |
Floor_South_4 |
Floor_West_4 |
Soil_Transect_4_4 |
Soil_Transect_3_4 |
Soil_Transect_2_4 |
Soil_Transect_1_4 |
SoilCO2_West_A_4 |
SoilCO2_West_B_4 |
SoilCO2_West_C_4 |
Floor_East_4 |
Avg | Spacial Count |
Measurement Count |
|---|---|---|---|---|---|---|---|---|---|---|---|---|---|---|---|---|---|---|---|---|---|---|---|---|---|---|---|---|---|---|---|---|---|---|---|---|---|---|---|---|---|---|---|---|---|---|---|---|---|---|
| 2018-01-03 | 3 | 0 | nan | 15.9 | 13.5 | 21.2 | 24.1 | 10.9 | 23.5 | 18.8 | 9.1 | 22.3 | 23.5 | 12.1 | 24.6 | 25.2 | 51.2 | 18.8 | 20.8 | 30.7 | 28.6 | 10.6 | 24 | 17.9 | 28 | 24.8 | 33.8 | 39.6 | 30.7 | 18.7 | 28.2 | 39.3 | 24.3 | 34.1 | 31.5 | 34.1 | 33.8 | 33.4 | 45.7 | 23.6 | 40.5 | 40 | 17.6 | 38 | 45.7 | 44.3 | ||||
| 2018-01-03 | 3 | 1 | nan | 15.6 | 12.7 | 19.1 | 27 | 10.3 | 18.8 | 18.2 | 8.8 | 27.9 | 22.3 | 11.2 | 25.2 | 24.9 | 43.9 | 20.3 | 20.3 | 29.8 | 28.6 | 11.2 | 24.9 | 17.9 | 28.3 | 25.1 | 33.2 | 39.6 | 30.1 | 18.4 | 29 | 30.1 | 24.3 | 33.2 | 31.7 | 34.1 | 34 | 33.1 | 23.7 | 41.1 | 40 | 17.6 | 30.5 | 46.3 | 44.8 | 23.8 | ||||
| 2018-01-03 | 3 | Avg | 0-15cm | 0 | 0 | |||||||||||||||||||||||||||||||||||||||||||||
| 2018-01-03 | 3 | Avg | 15-30cm | 0 | 0 | |||||||||||||||||||||||||||||||||||||||||||||
| 2018-01-03 | 3 | Avg | 30-45cm | 0 | 0 | |||||||||||||||||||||||||||||||||||||||||||||
| 2018-01-03 | 3 | Avg | 45-60cm | 0 | 0 |
mode = both
Moisture Point Probes VR
Array
(
[0] => Solar_Panels_1
[1] => Flux_Tower_1
[2] => Gate_1
[3] => Biomass_Cage_1
[4] => Solar_Panels_2
[5] => Flux_Tower_2
[6] => Gate_2
[7] => Biomass_Cage_2
[8] => Solar_Panels_3
[9] => Flux_Tower_3
[10] => Gate_3
[11] => Biomass_Cage_3
[12] => Solar_Panels_4
[13] => Flux_Tower_4
[14] => Gate_4
[15] => Biomass_Cage_4
)
| Date | DOY | Rep | Depth | Solar_Panels_1 |
Flux_Tower_1 |
Gate_1 |
Biomass_Cage_1 |
Solar_Panels_2 |
Flux_Tower_2 |
Gate_2 |
Biomass_Cage_2 |
Solar_Panels_3 |
Flux_Tower_3 |
Gate_3 |
Biomass_Cage_3 |
Solar_Panels_4 |
Flux_Tower_4 |
Gate_4 |
Biomass_Cage_4 |
Avg | Spacial Count |
Measurement Count |
|---|---|---|---|---|---|---|---|---|---|---|---|---|---|---|---|---|---|---|---|---|---|---|
| 2018-01-03 | 3 | 0 | nan | 19.7 | 17.1 | 22.1 | 12.1 | 25.2 | 27.7 | 13.8 | 18.2 | 28.2 | 14.3 | 23.6 | 28.2 | 38.8 | 25.9 | 17.6 | 28.5 | |||
| 2018-01-03 | 3 | 1 | nan | 19.4 | 16.5 | 18.8 | 11.5 | 4.6 | 27.7 | 14.8 | 18.2 | 27.9 | 13.4 | 23.2 | 27.9 | 38.8 | 26.2 | 17.9 | 28.5 | |||
| 2018-01-03 | 3 | Avg | 0-15cm | 0 | 0 | |||||||||||||||||
| 2018-01-03 | 3 | Avg | 15-30cm | 0 | 0 | |||||||||||||||||
| 2018-01-03 | 3 | Avg | 30-45cm | 0 | 0 | |||||||||||||||||
| 2018-01-03 | 3 | Avg | 45-60cm | 0 | 0 |
No TZ grass heigth found
No VR grass heigth found
No VR Tree DBH found
No water potential data found
No VR Grass Biomass data found
No VR OakLeaves Biomass data found
No VR PineNeedles Biomass data found
1 photos found
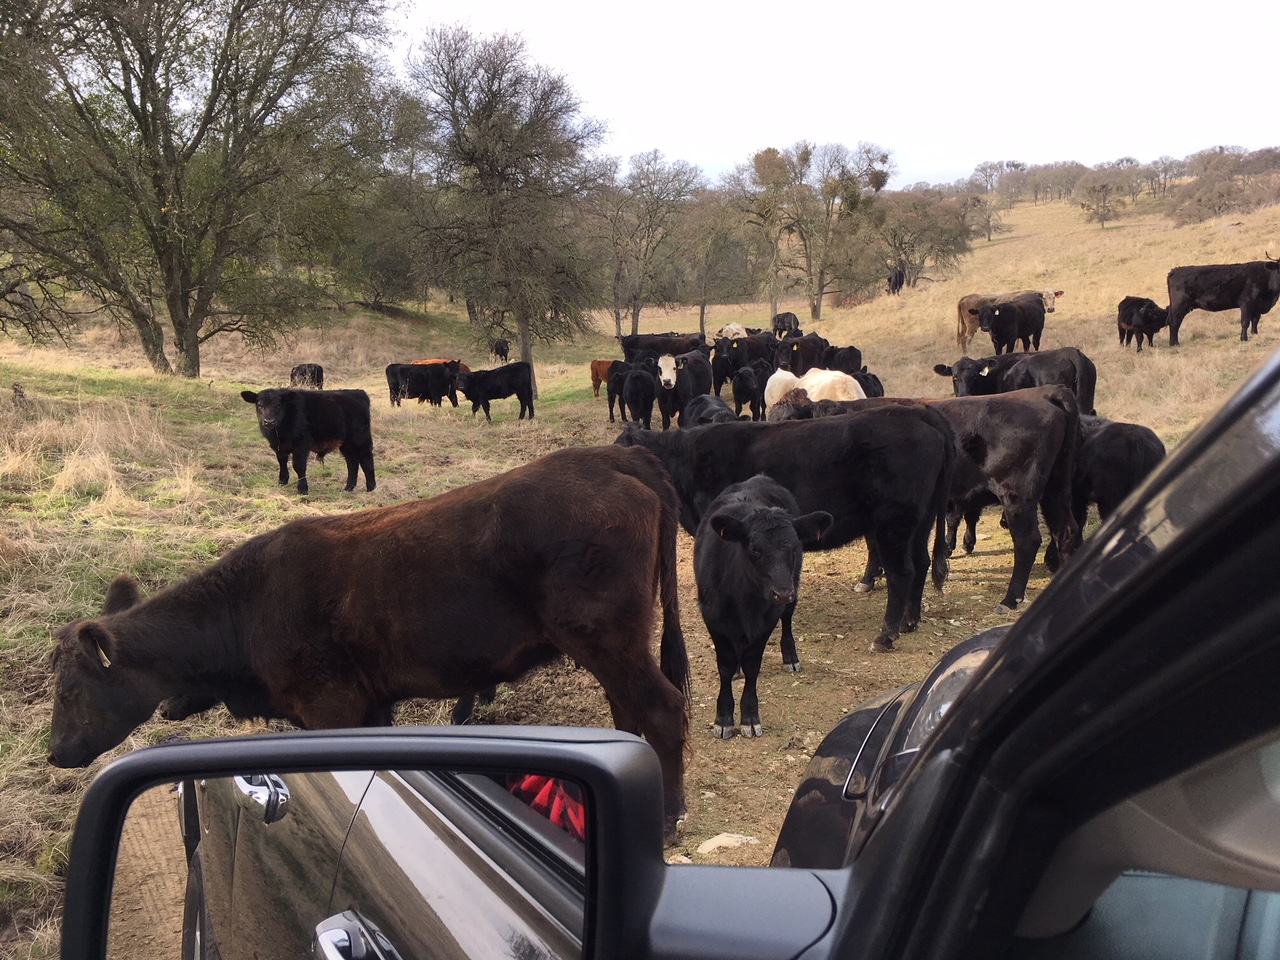
20180103VR_MorningTraffic.jpg ( 2018-01-03 10:29:00 ) Full size: 1280x960
Morning rush hour at Vaira
9 sets found
16 VR_met graphs found
2 VR_flux graphs found
6 VR_soilco2 graphs found
2 VR_pond graphs found
Can't check TZVR_mixed
3 VR_fd graphs found
No data found for VR_processed.
No data found for VR_arable.
No data found for VR_soilvue.