
Field Notes
<--2017-11-17 11:30:00 | 2017-12-18 11:10:00-->Other sites visited today: Bouldin Alfalfa | Bouldin Corn | Mayberry | Sherman Wetland | West Pond | East End
Phenocam link: Searching...
Twitchell Alfalfa: 2017-11-30 14:25:00 (DOY 334)
Author: Daphne Szutu
Others: Elke, Kyle
Summary: Regular data collection/cleaning, add Arable solar panel, sheep in field
| 2017-11-30 Twitchell Alfalfa We arrived at 14:25. It was sunny, calm, and cool, with thin high clouds. There were sheep fences set up right up next to our tower, and the field to the west of the tower has been thoroughly mowed by sheep. We had to park next to the fences and jumped a low fence to get to our tower. There were sheep to the east of our tower, with some very fresh lambs. We decided not to put out the castor oil pellets (squirrel repellents) today so that we did not accidentally dose the sheep. I collected met, soil CO2, camera, and USB GHG data. LI-7500 readings: CO2 379.3 ppm H2O 473 mmol/m3 T 17.6 C P 101.9 kPa SS 93 --> 99 after cleaning Kyle installed a supplemental solar panel for the Arable Mark and cleaned the EC and radiation sensors. Elke took soil respiration measurements. We left at 15:20. |
2 photos found

20171130TA_Arablesolar.JPG ( 2017-11-30 15:16:30 ) Full size: 1920x1440
Supplemental solar panel added to Arable Mark. Sheep grazing right next to tower.
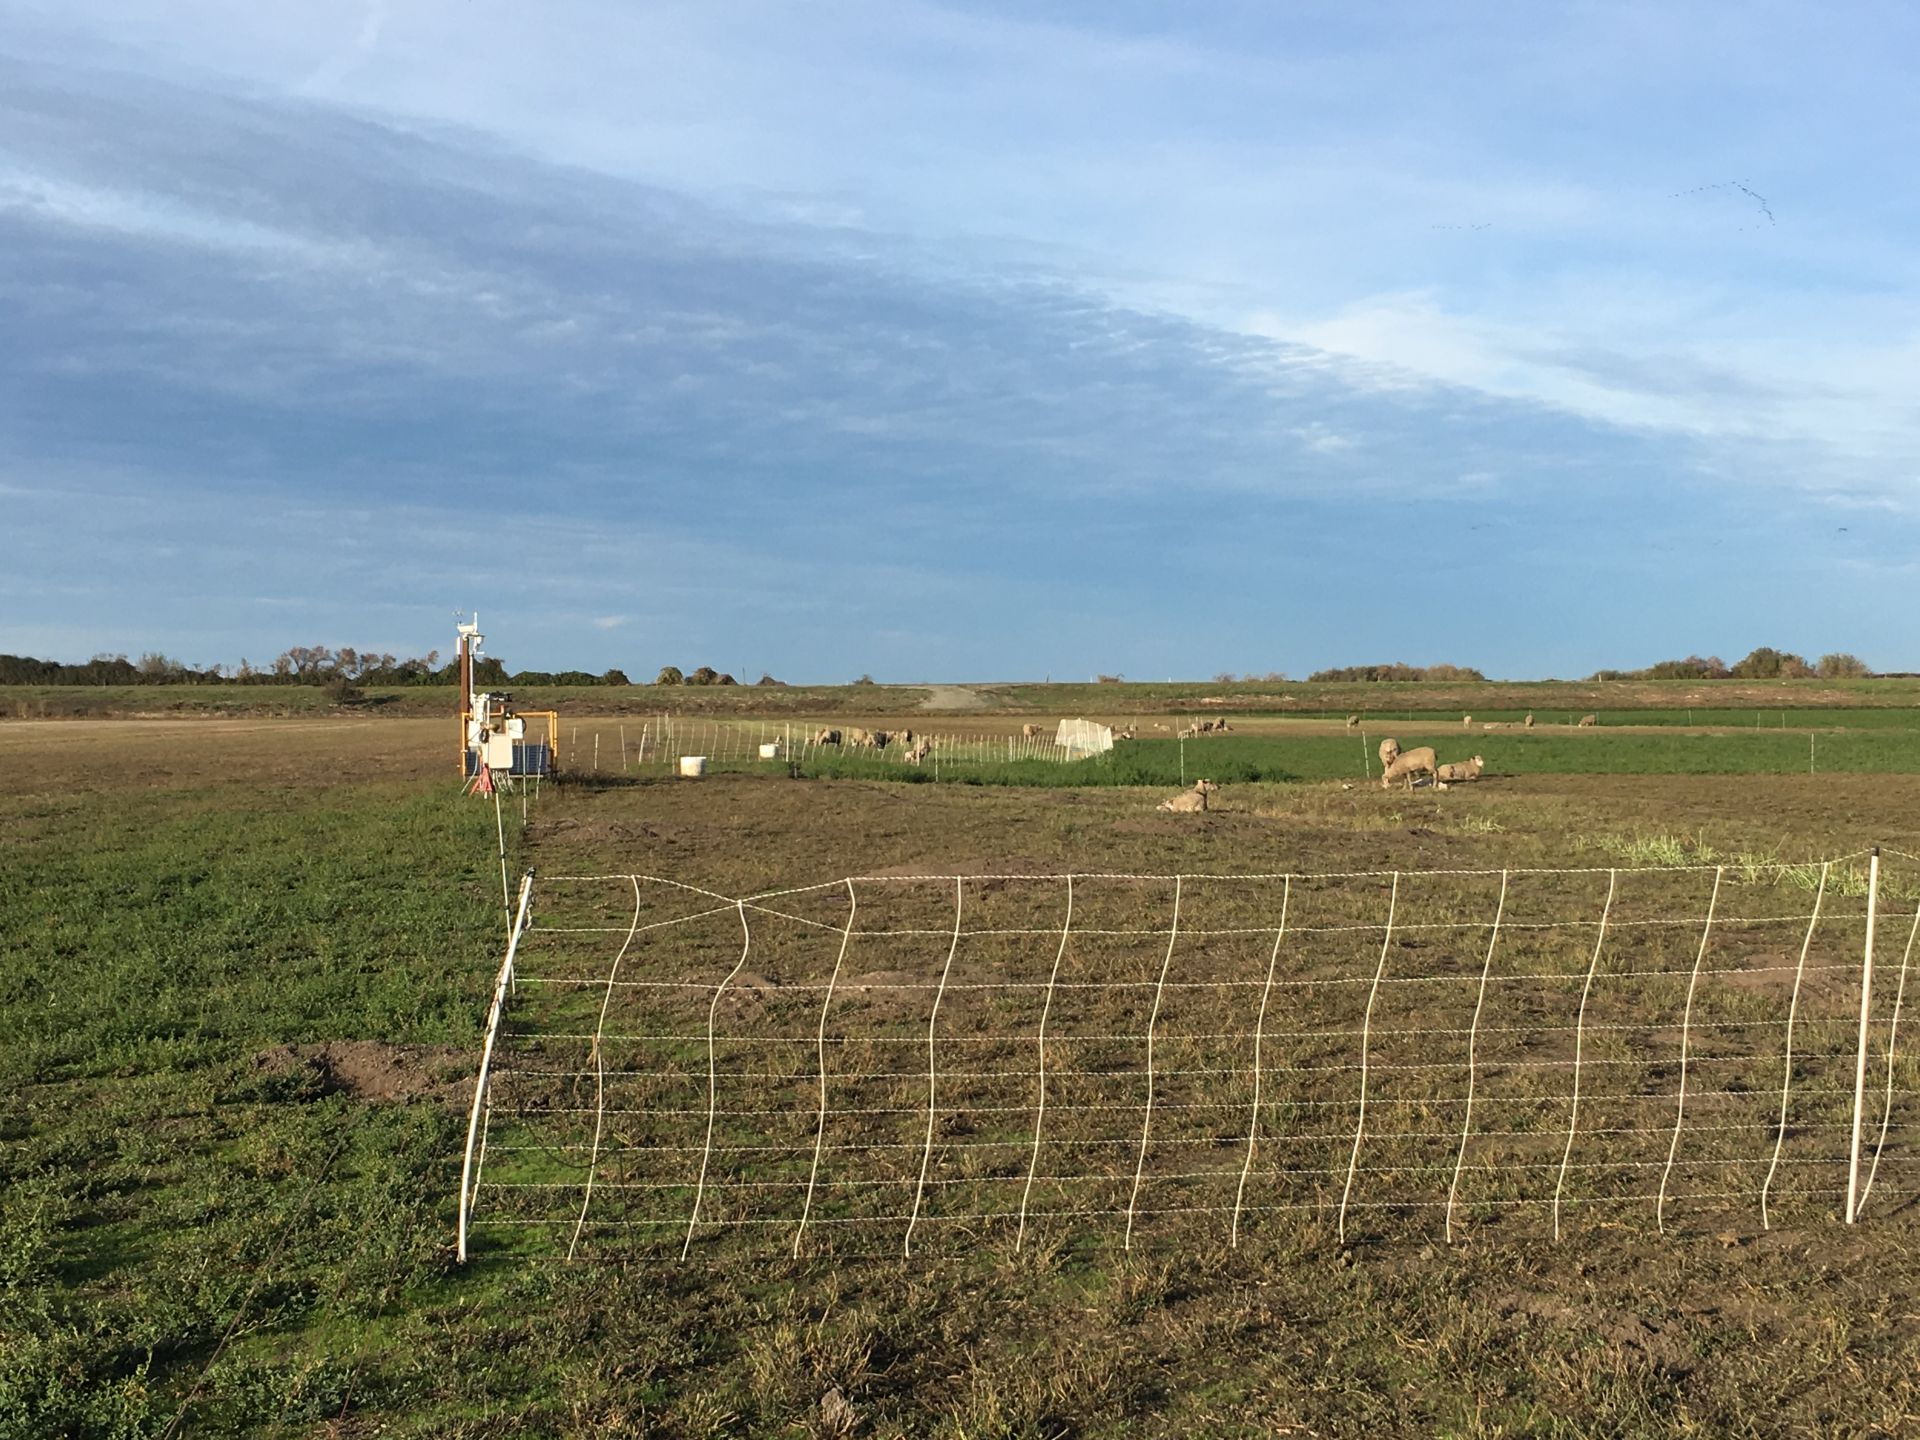
20171130TA_sheep.JPG ( 2017-11-30 15:20:01 ) Full size: 1920x1440
Sheep paddock set up right next to our tower.
7 sets found
Can't check TA_met
11 TA_met graphs found
Can't check TA_rad
3 TA_rad graphs found
Can't check TA_flux
5 TA_flux graphs found
Can't check TA_soilco2
7 TA_soilco2 graphs found
1 TA_arable graphs found
1 TA_cam graphs found
Can't check TATWBABCSB_cam