Field Notes
<--2017-11-10 10:00:00 | 2017-12-19 11:00:00-->Other sites visited today: Bouldin Corn | Twitchell Alfalfa | Mayberry | Sherman Wetland | West Pond | East End
Phenocam link: Searching...
Bouldin Alfalfa: 2017-11-30 12:05:00 (DOY 334)
Author: Daphne Szutu
Others: Elke, Kyle
Summary: Regular data collection/cleaning, clip plots, veg height, spectral measurements
| 2017-11-30 Bouldin Alfalfa We arrived at 12:05. It was sunny, cool, and calm, with a few wispy clouds. The alfalfa is tall and might be mowed soon. The dirt roads from BC to this site had some wet spots, but it wasn't too muddy. The field was dry enough to drive onto. Elke took 5 biomass samples (clip plots), Kyle took spectral measurements, and I took veg height measurements. I collected met, camera, and USB GHG data. The rubber seal on the inside cover of the met box is loose and should be re-glued. When the 7550 time was 12:06:04, I changed it to 12:14:04, then reset the box. Kyle cleaned EC and radiation sensors. There were fine spiderwebs everywhere. The wash reservoir was 1/3 full; we refilled it. LI-7500 readings: CO2 440 ppm H2O 520 mmol/m3 T 14.8 C P 102.1 kPa SS 100 --> 100.5 after cleaning LI7700 readings: CH4 2.15 ppm --> 2.16 after cleaning RSSI 41 --> 84.6 after cleaning We left at 12:30. |
Next Mowing: 2018-01-13
Veg Height (cm): Tape measure from ground to top of plant
32, 35, 24, 31, 33, 26, 30, 26, 28, 32, 28, 35, 34, 27, 34, 29, 23, 44, 50, 42, avg = 32.2, stdev = 6.82
2 photos found
20171130BA_Elkevest.JPG ( 2017-11-30 12:29:16 ) Full size: 1920x1440
Elke wearing our brand-new safety vests while taking biomass samples.

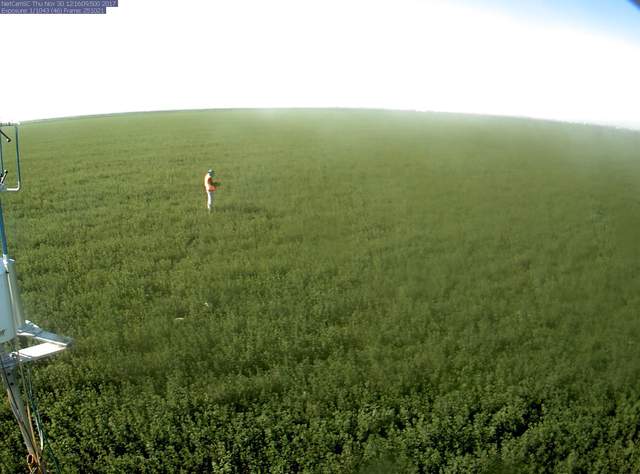
bouldinalfalfa_2017_11_30_121609.jpg ( 2017-11-30 12:19:02 ) Full size: 1296x960
Elke in the field with new safety vest
7 sets found
5 BA_flux graphs found
21 BA_met graphs found
No data found for BA_arable.
Can't check TATWBABCSB_cam
Can't check MBSWEEWPBCBA
2 BA_processed graphs found
No data found for BA_adex.

