
Field Notes
<--2017-11-27 02:30:00 | 2017-12-18 09:25:00-->Other sites visited today: Bouldin Alfalfa | Bouldin Corn | Twitchell Alfalfa | Mayberry | West Pond | East End
Phenocam link: Searching...
Sherman Wetland: 2017-11-30 09:20:00 (DOY 334)
Author: Daphne Szutu
Others: Elke, Kyle
Summary: Regular data collection/cleaning, swapped LI-7500 for calibration, downgraded LI-7550 to v8.5.0, fixed LI-7700 wash settings
| 2017-11-30 Sherman Wetland We arrived at 9:20. It was cool and calm, sunny and clear. The wetland is still green, though the tips of the plants are starting to brown. Kyle cleaned the EC and radiation sensors. We refilled the wash reservoir; it was completely empty. The wash settings had been wrong; it had been set to wash every 30 min when RSSI dropped below 80%; I changed it to wash every 3 hours when the RSSI drops below 30%. Before swapping the LI-7500, I downloaded the LI-7500 configuration file and downgraded the LI-7550 sn AIU-1569 from v 8.7.5 to v8.5.0. We swapped LI-7500: sn 75H-2667 came down, and sn 0073 went up. I uploaded a new config file and updated the pressure coefficients. We had planned to swap LI-7700s. But, when we put up the freshly calibrated 7700 (sn TG1-0224) the temperature read -9C, increasing up to -8C as we observed. We put the original 7700 (sn TG1-0421) back up on the tower. LI-7500 readings: (old sensor with v8.7.5 --> old sensor with v8.5.0 --> new sensor with v8.5.0) CO2 406.7 ppm --> 407.5 --> 433.4 H2O 508.9 mmol/m3 --> 505.1 --> 380.2 T 12.5 C --> 12.1 --> 13.3 P 102.2 kPa --> 102.2 --> 102.2 SS 98.2 --> 98.2 --> 98.7 LI7700 readings: CH4 2.0 ppm --> 2.18 after cleaning RSSI 10 --> 75.1 after cleaning I collect met, camera, and USB GHG data. We left at 10:05. |
1 photos found
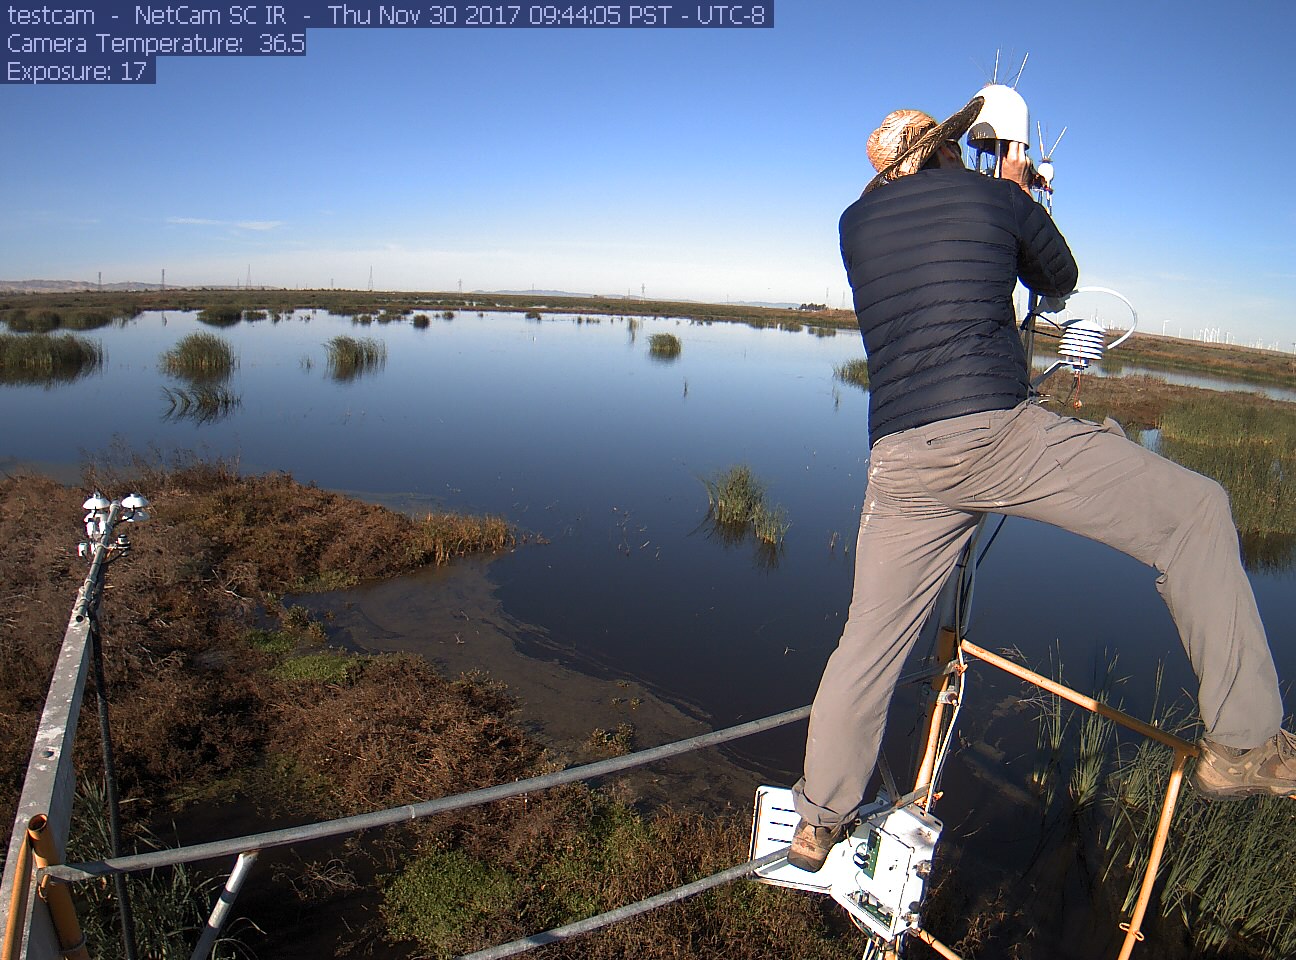
siwetland_2017_11_30_094405.jpg ( 2017-11-30 09:48:30 ) Full size: 1296x960
Kyle cleaning
7 sets found
Can't check MBWPEESWGT_mixed
Can't check MBEEWPSWEPGT_cam
15 SW_met graphs found
4 SW_flux graphs found
Can't check MBSWEEWPBCBA
Can't check SW_Temp
14 SW_Temp graphs found
No data found for SW_arable.