Field Notes

<--2017-08-16 10:30:00 | 2017-08-30 13:15:00-->
Other sites visited today: Sherman Wetland | Vaira | Tonzi

Mayberry: 2017-08-17 08:55:00 (DOY 229)
Author: Daphne Szutu
Others: Joe Verfaillie

Summary: Collect water samples for Isabel

2017-08-17
Mayberry Wetland

We arrived around 8:55. It was clear, cool, and windy. Joe collected 3 water samples for Isabel at 8:00 PST (9:00 PDT). We left at 9:05.

I added acid and refrigerated the water samples on 2017-08-18 10:00 PST (11:00 PDT)

1 photos found

view of field site
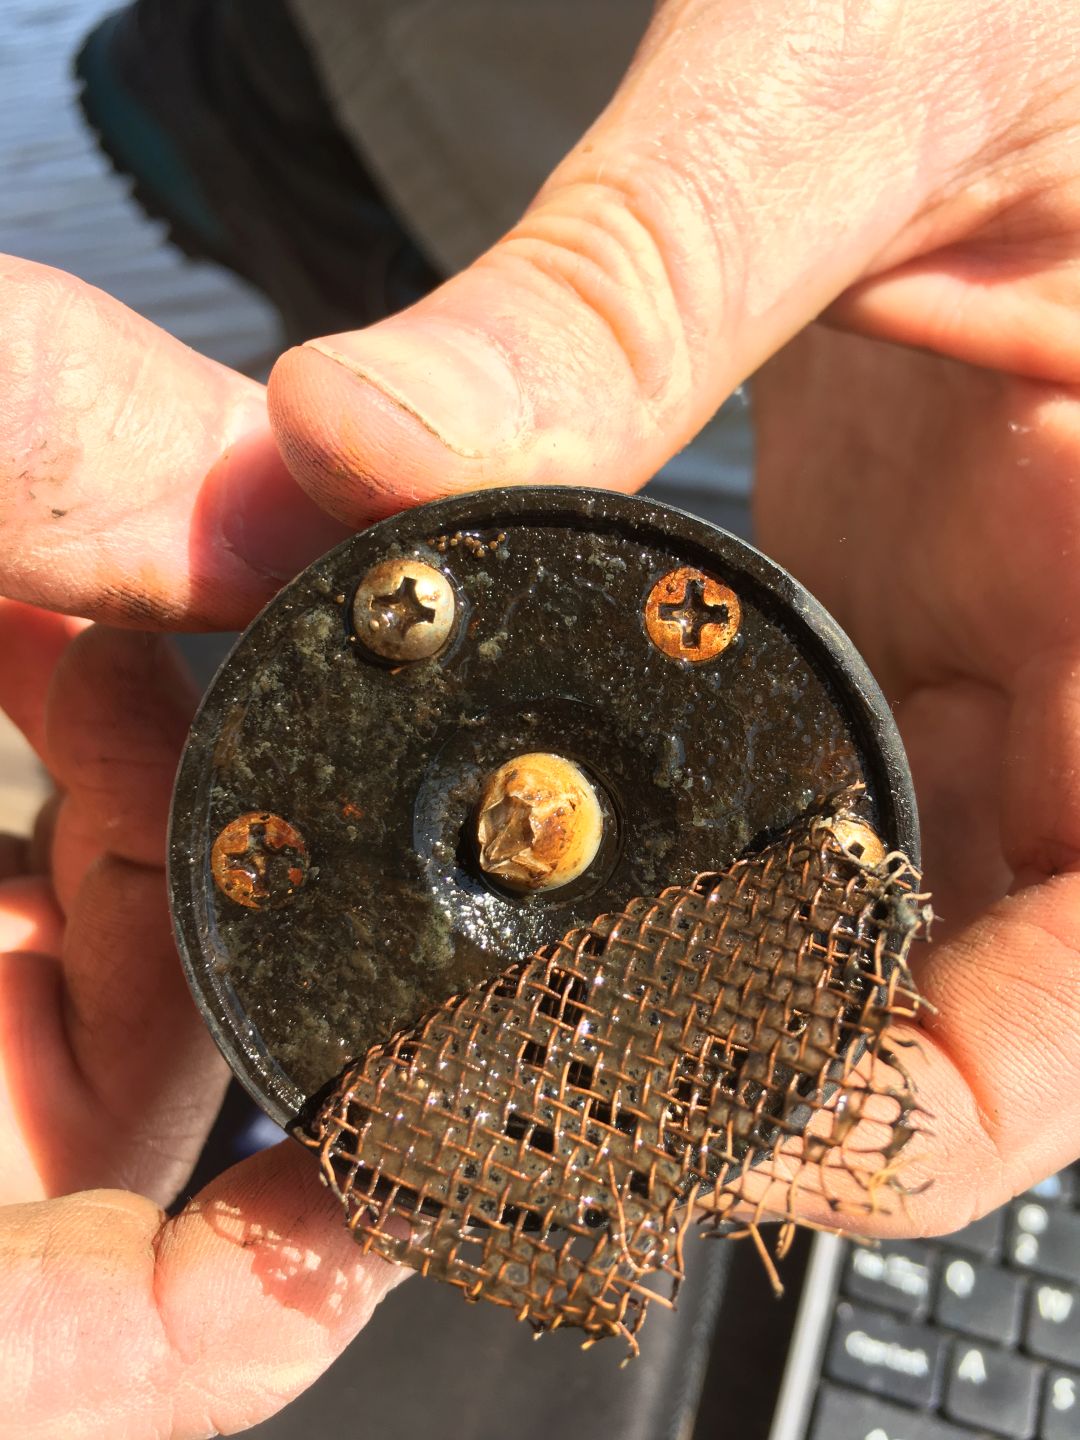
20170816MB_miniDOTbarnacle.JPG ( 2017-08-16 11:03:46 ) Full size: 1080x1440
view of field site

Graphs display:
11 sets found

7 MB_flux graphs found

Explore the graph:Sonic Wind in a new window

Explore the graph:LI7700 mV signals in a new window

Explore the graph:Counts in a new window

Explore the graph:LI7700 CH4 from analog signal in a new window

Explore the graph:LI7500 CO2 and H2O in a new window

Explore the graph:LI7700 CH4 from digital signal in a new window

Explore the graph:CO2 in ppm in a new window

No data found for MB_met.
27 MB_tule graphs found

Explore the graph:MB Tule Tower: Open Water 2 (3/1/11-3/23/17) in a new window

Explore the graph:MB Tule Tower: Open Water 1 (3/1/11-2/21/13) in a new window

Explore the graph:MB Tule Tower: Tule Temps 2 & 3 (3/1/11-3/19/14) in a new window

Explore the graph:MB Tule Tower: Tule Temps 1 (3/1/11-3/19/14) in a new window

Explore the graph:Mayberry Tule Tower: Solar Radiation in a new window

Explore the graph:Mayberry Tule Tower: Disolved Oxygen in a new window

Explore the graph:Mayberry Tule Tower: IRT and Sensor Temp in a new window

Explore the graph:Mayberry Tule Tower: Volts and RH in a new window

Explore the graph:LED NDVI Sensor in a new window

Explore the graph:Water CO2 in a new window

Explore the graph:Water Pressure in a new window

Explore the graph:Fluorometer Data in a new window

Explore the graph:Mayberry pCO2 Profile in a new window

Explore the graph:Water Temperatures in a new window

Explore the graph:Air Temperatures in a new window

Explore the graph:Air Pressure in a new window

Explore the graph:4-Way Radiometer in a new window

Explore the graph:MB Tule Tower: Open Water 1 (2/21/13-3/19/14) in a new window

Explore the graph:MB Tule Tower: Tule Temps 1 (3/19/14-now) in a new window

Explore the graph:MB Tule Tower: Open Water 1 (3/19/14-now) in a new window

Explore the graph:MB Tule Tower: Tule Temps 2 & 3 (3/19/14-3/23/17) in a new window

Explore the graph:MB Tule Tower: Tule Temps 2 (3/23/17-now) in a new window

Explore the graph:MB Tule Tower: Tule Temps 3 (3/23/17-now) in a new window

Explore the graph:SRS NDVI Channels in a new window

Explore the graph:SRS NDVI in a new window

Explore the graph:Net Radiation in a new window

Explore the graph:Conductivity in a new window

Can't check MBWPEESWGT_mixed
1 MB_cam graphs found

Explore the graph:Mayberry Autocam GCC in a new window

Can't check MBEEWPSWEPGT_cam
Can't check SIMBTWEE_met
1 MB_minidot graphs found

Explore the graph:Mayberry miniDot Dissolved Oxygen in a new window

Can't check MBSWEEWPBCBA
1 MB_processed graphs found

Explore the graph:Mayberry processed CO2 Fluxes in a new window

Can't check MB_fd
1 MB_fd graphs found

Explore the graph:Water Forced Diffusion CO2 Flux in a new window