Field Notes
<--2017-08-01 09:30:00 | 2017-08-04 12:00:00-->Other sites visited today: Mayberry | Sherman Wetland | West Pond
Phenocam link: Searching...
East End: 2017-08-02 09:25:00 (DOY 214)
Author: Ada Chang
Others: Daphne Szutu, Sam Chamberlain
Summary: Power outages at T1 and T2.
| Boardwalk T3 Arrived at 9:25. The weather was sunny, warm and clear. The wash reservoir was empty. The hose had come off, so it was reattached. Collected miniDOT sn 1219 data and removed the device. LI7500 readings: CO2 16.4 (this number is mmol/m3 instead of ppm and should be 10 to 25) H2O 825.4 T 28.0 P 101 SS (no SS data) LI7700 readings: CH4 2.3 -> 2.2 RSSI 13.3 -> 67.6 Left at 9:50. Permanent Tower Arrived at 9:53. The weather was unchanged. Installed the miniDOT from T3. Wasps were found in the wash reservoir and the reservoir was filled from about 4/5ths full. The CAM card remained unchanged. LI7500 readings: CO2 422.1 H2O 756.7 T 27.6 P 101.1 SS 92.4 -> 94.4 LI7700 readings: CH4 2.1 RSSI 39.7 -> 82.6 Left at 10:13. Open Water T1 Arrived at 10:22. The weather was slightly breezier. The tower was dead when Sam went in to collect data. Collected MET data and swapped out battery. Wash box was refilled. Daphne examined the charge controller. Battery volts = 26V Load amps = 0A Solar amps = 0A Cleaning the solar panel didn’t help. Restarting the charge controller resulted in the solar amp level to go to 0.3A. The physical connections seemed okay, so the cause of the power outage is a mystery. Left at 10:50. Closed Vegetation T2 Kyle and Elke arrived at around 10:30 to install the new raspberry pi camera. We put up the camera box on the south-western corner of the tower facing out into the wetland. We wired up the raspberry pi but discovered that there was no power at the site so we could not test it. We left it wired up so it should just come on once the power is restored. Left at 10:40. Arrived at 10:52. The weather was sunny and hot. The power was out prior to arrival. Daphne and Sam checked the charge controller. The solar amp level and the load amp level were 0A. The wires close to the data logger from the battery were chewed up. Daphne trimmed the wires and measured the amps with a multimeter but could not get it to work. The charge controller was reset, which caused no change. A small battery was attached to the CR6 to collect data—1.5 days of MET data were recovered. Finally, a fan was connected to the data logger power leads to see if that would run, but it did not. Left at 11:30. |
4 photos found

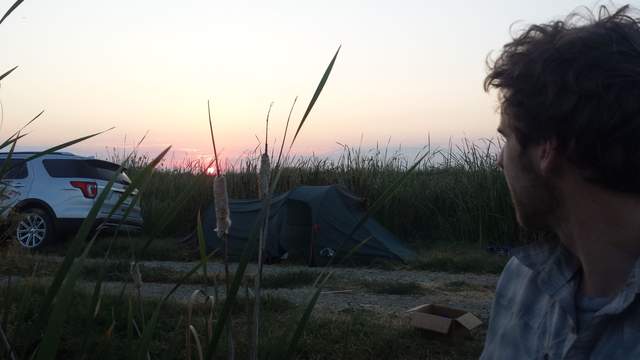
20170801EE_Dusk.jpg ( 2017-08-01 20:45:22 ) Full size: 1920x1080
Dusk view from 24-hr leaf-level campaign

20170802EE_Dawn.jpg ( 2017-08-02 06:21:01 ) Full size: 1920x1080
Kyle admiring the sunset during the 24-hr leaf-level campaign

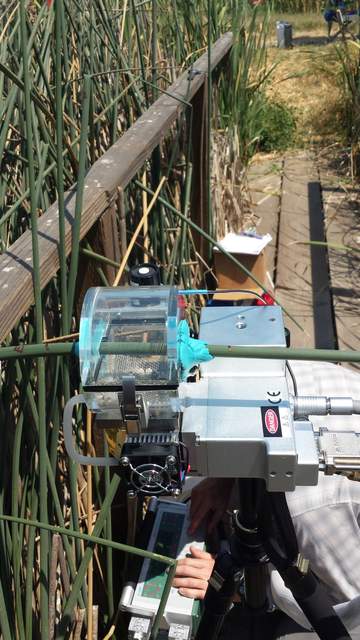
20170801EE_LeafChamber.jpg ( 2017-08-01 13:51:15 ) Full size: 1080x1920
Kyle using the LI-6400 with a transparent leaf chamber

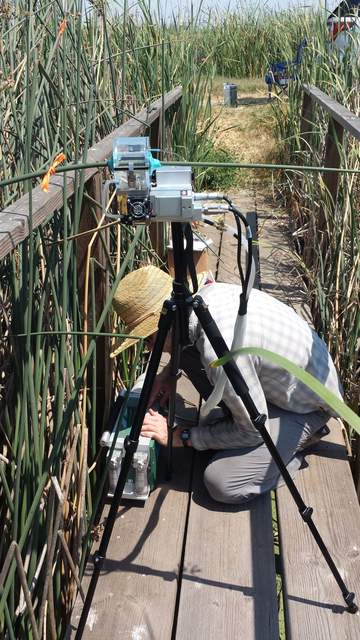
20170801EE_LeafKyle.jpg ( 2017-08-01 13:51:07 ) Full size: 1080x1920
Kyle using the LI-6400 with a transparent leaf chamber
11 sets found
14 EE_met graphs found
Can't check EE_mixed
1 EE_mixed graphs found
8 EE_flux graphs found
Can't check MBWPEESWGT_mixed
1 EE_cam graphs found
Can't check MBEEWPSWEPGT_cam
Can't check SIMBTWEE_met
Can't check EE_Temp
5 EE_Temp graphs found
Can't check EE_minidot
1 EE_minidot graphs found
Can't check MBSWEEWPBCBA
1 EE_processed graphs found

