
Field Notes
<--2017-07-19 11:00:00 | 2017-08-02 09:25:00-->Phenocam link: Searching...
East End: 2017-08-01 09:30:00 (DOY 213)
Author: Elke Eichelmann
Others: Kyle Hemes
Summary: 24-hour diurnal measurements of photosynthesis and stomatal conductance
| Kyle and I arrived at East End wetland at around 9:30. It was a sunny and clear day and it got extremely hot in the early afternoon (the 6400 registered an air temperature of 45 Celsius!). We used the borrowed LI-6400 from Whendee Silver's lab with our slightly modified clear conifer chamber head for a 24-hour campaign of leaf level photosynthesis and water exchange measurements. There was a ton of mosquitos out around dusk and dawn which was annoying, but we also heard the otters splash around in the water at night, which was cute. The sunset and sunrise over the wetland were also quite amazing. We took measurements approximately every 1 to 1.5 hours throughout the 24 hour period, but less at night. We took measurements at the following times: 10:15 - 10:50 11:15 - 11:50 12:15 - 12:50 13:40 - 14:30 15:20 - 16:00 16:40 - 17:05 19:00 - 19:20 20:00 - 20:20 22:00 - 22:30 4:50 - 5:20 6:00 - 6:40 7:30 - 8:00 9:00 - 9:40 We matched the IRGAs several times throughout especially during times when concentrations were changing significantly, in the late afternoon and early morning. We took measurements on 3 tules and 3 cattails, trying to use the same plants throughout the campaign as much as we could, but we switched plants when we saw clear signs of folds or bents from repeated measurements in the plants, since we weren't sure if those affected nutrient and water transport. We managed to carry one tule and one cattail plant through the entire measurement period without being bent. We took the measurements off the boardwalk a few meters north of the EC tower. Most measurements were taken approximately a third of the way from the top the plants down, and all were in the top half of the plants. We used full bypass for both CO2 scrub and desiccant on almost all measurements and a flow rate of 500 on most. We increased the flow rate to 700 in the afternoon when plants showed signs of stress and measurements were very unstable. We also increased the CO2 scrub to half way between scrub and bypass at night when CO2 concentrations increased quite drastically. For all measurements we held the leafs horizontally, regardless of how they were oriented in the field. Daphne, Sam, and Ada stopped by briefly around 9:30 on August 2 as they were starting their field day in the wetlands. We took the last measurement between 9 and 10am and left around 10:30. |
Veg Height (cm): Tape measure from ground to top of plant - Green plants from 30cm x 30cm plots 7m to 10m apart along a transect upwind from the tower. From Sophie
325.12, 375.92, 342.9, 274.32, 762, 299.72, 299.72, 368.3, 355.6, 279.4, 114.3, 274.32, 116.84, 330.2, 269.24, 290, 360, 350, 340, 350, avg = 259.7, stdev = 116.78
4 photos found
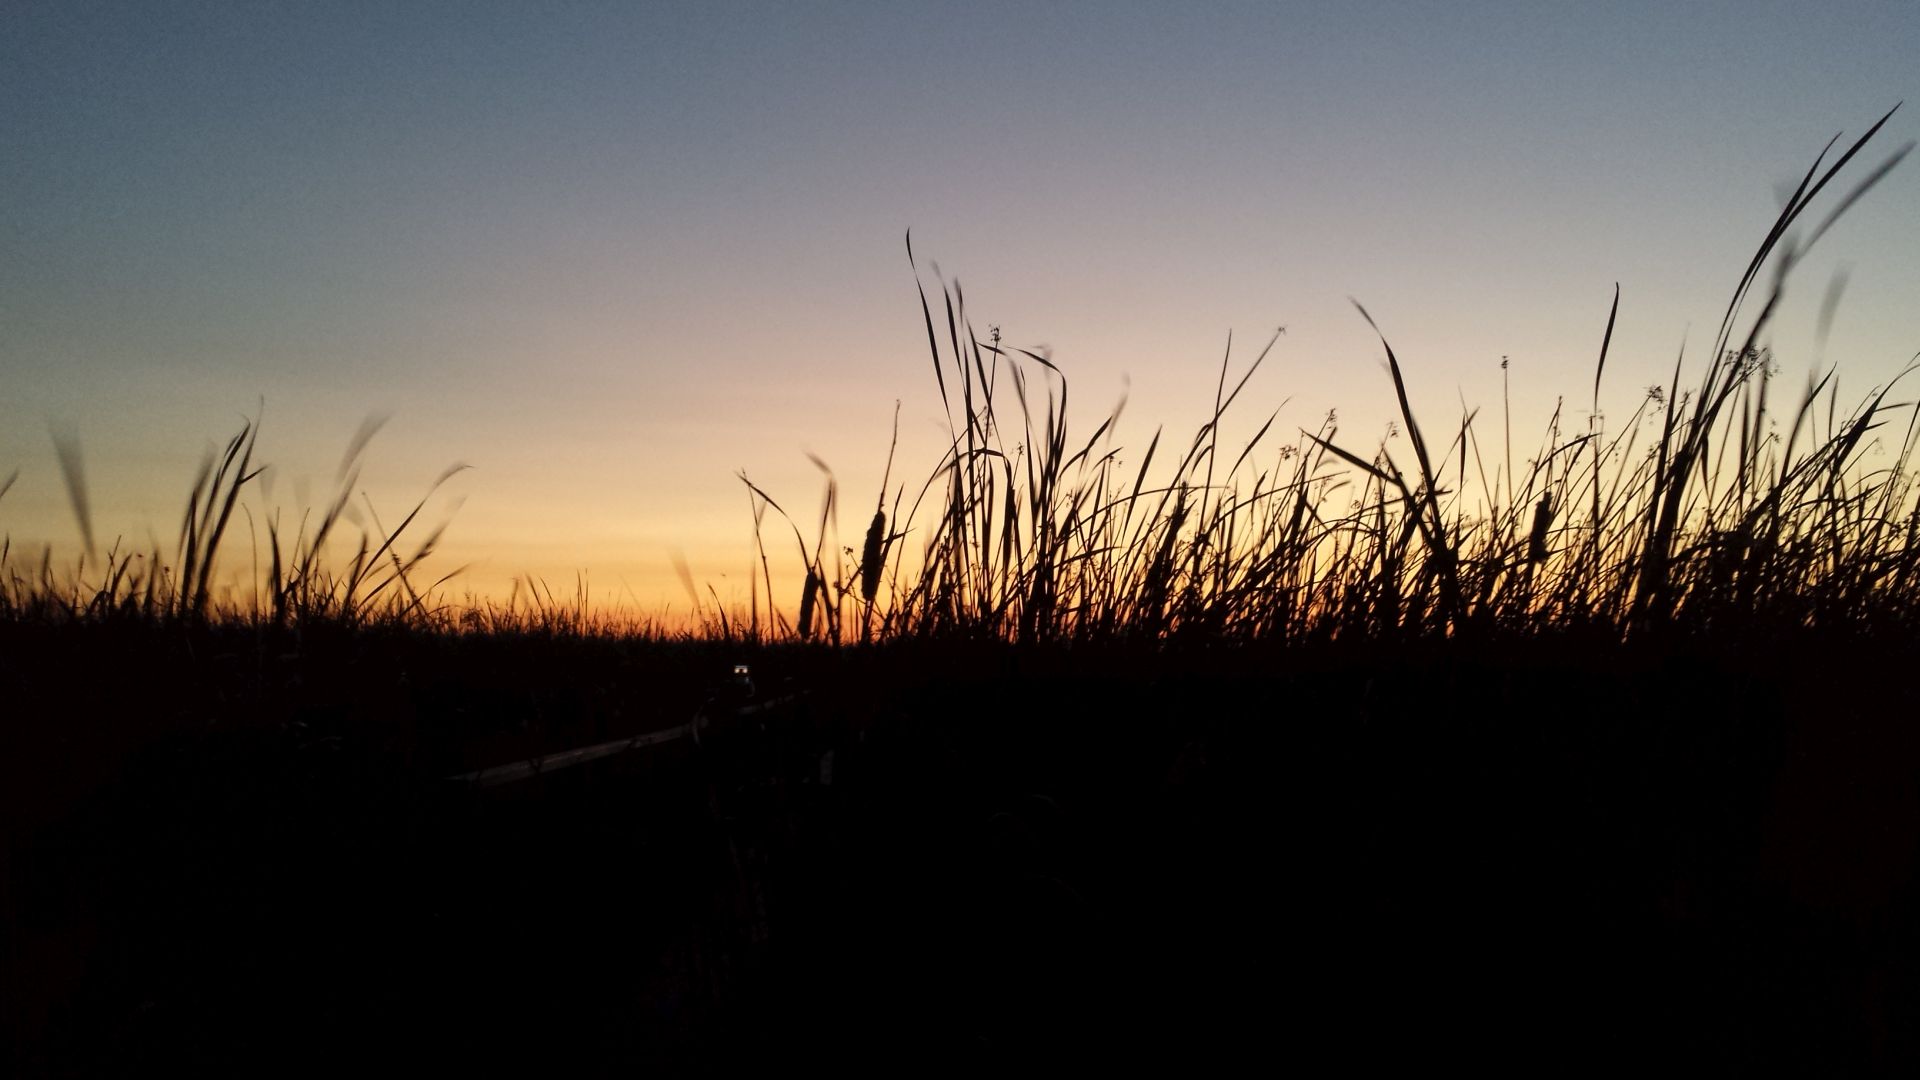
20170801EE_Dusk.jpg ( 2017-08-01 20:45:22 ) Full size: 1920x1080
Dusk view from 24-hr leaf-level campaign
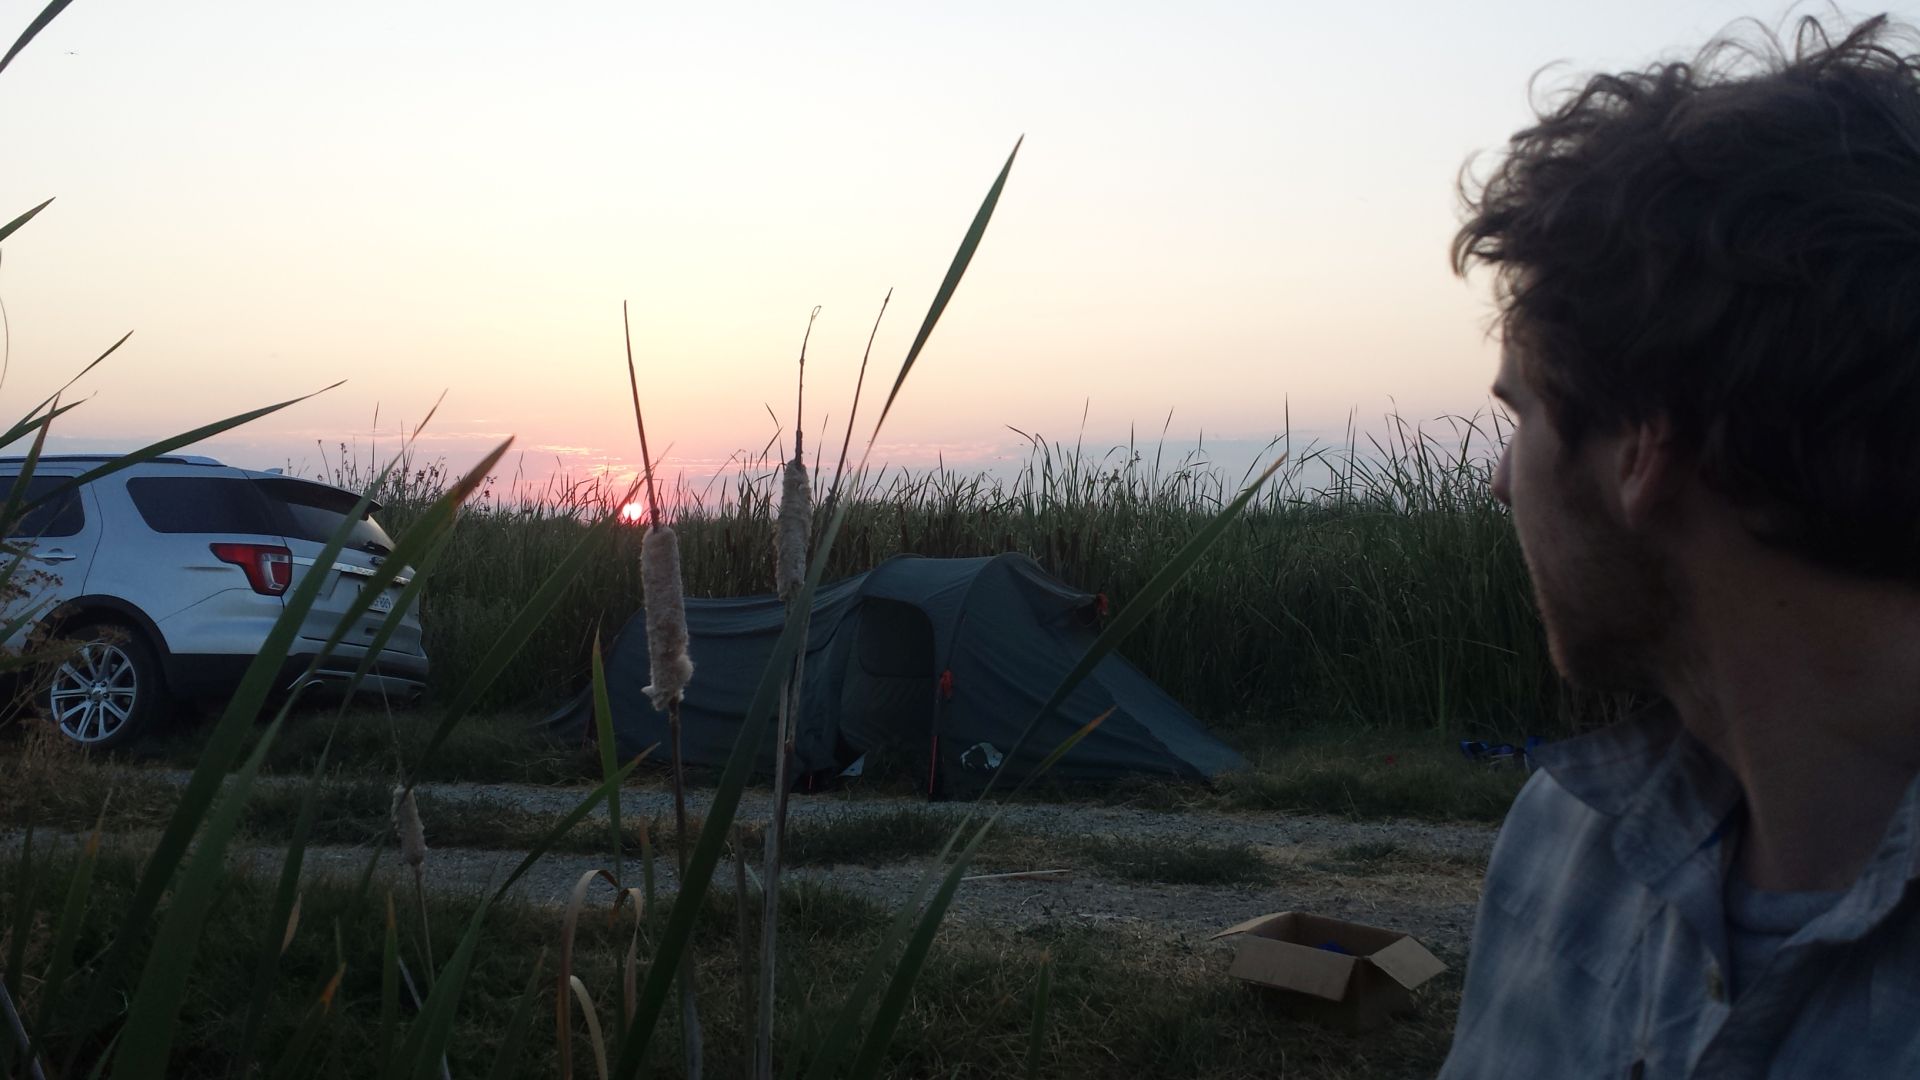
20170802EE_Dawn.jpg ( 2017-08-02 06:21:01 ) Full size: 1920x1080
Kyle admiring the sunset during the 24-hr leaf-level campaign
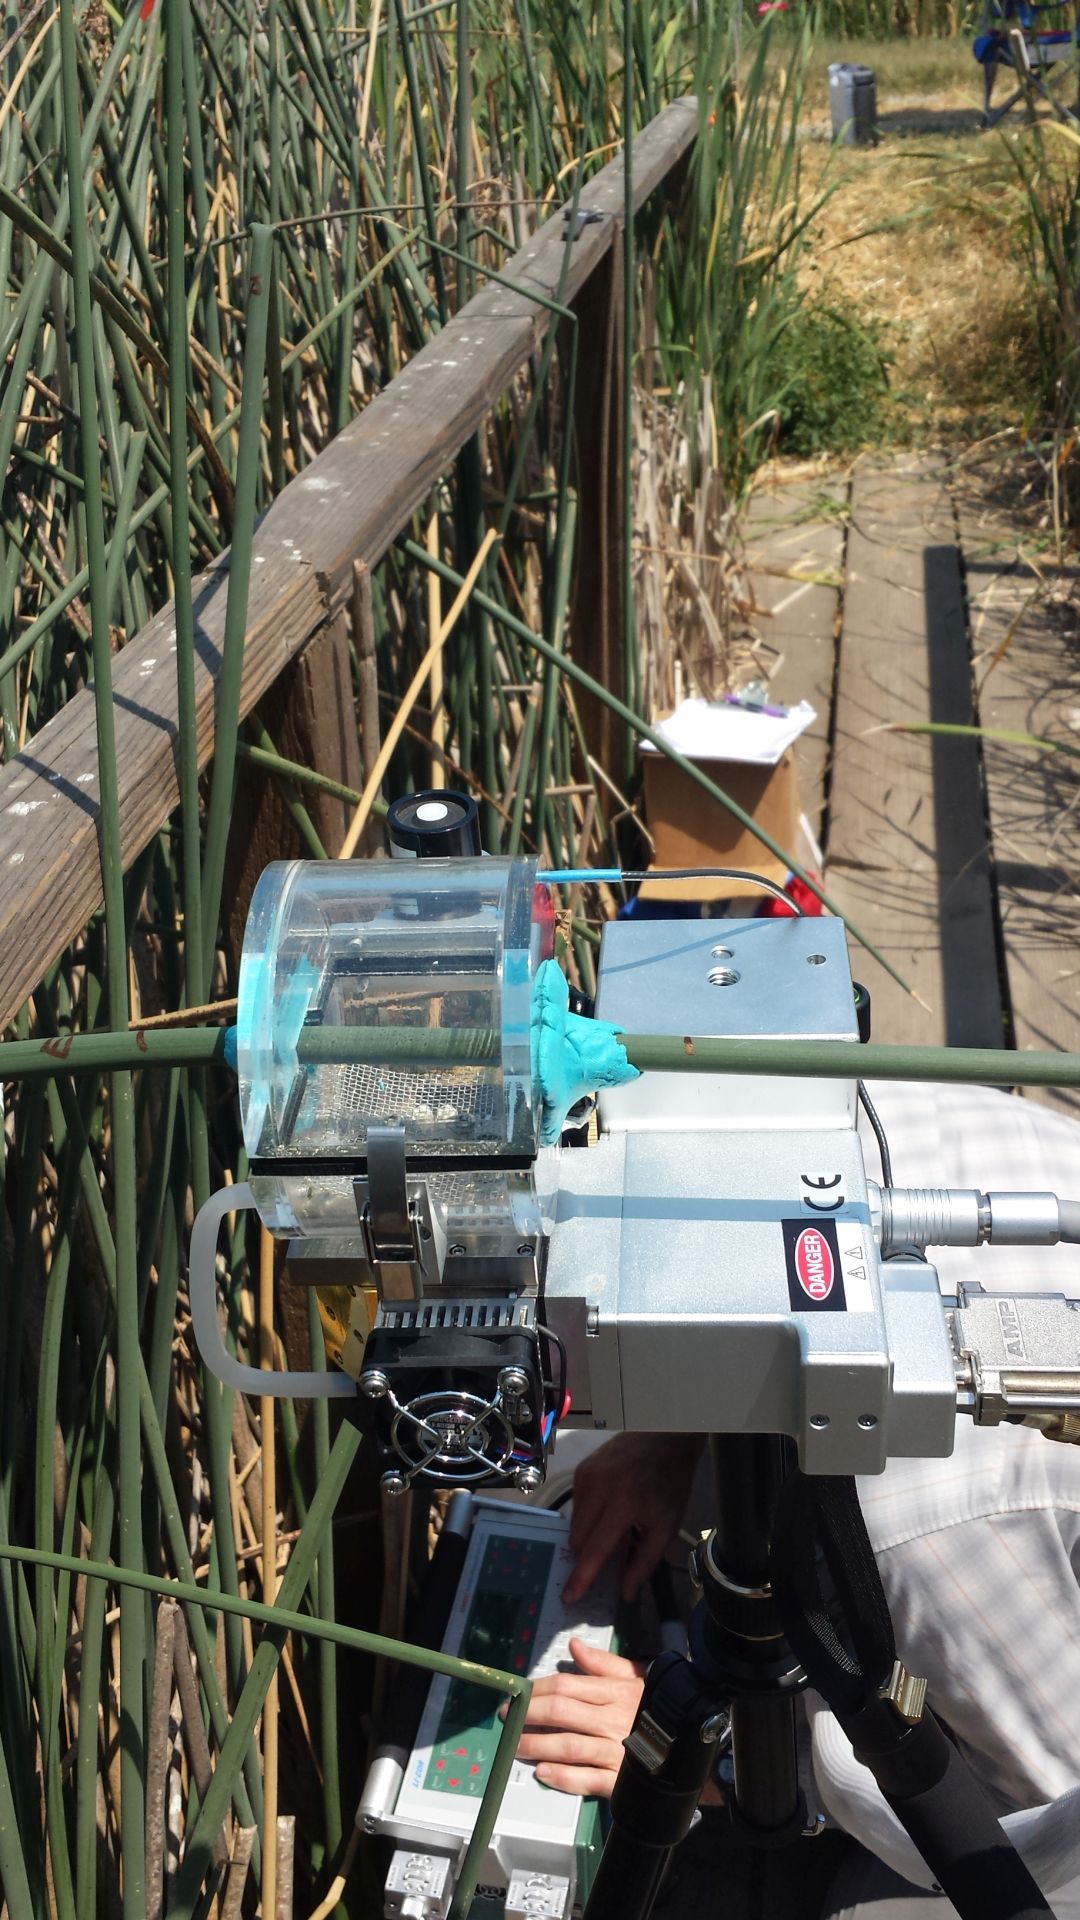
20170801EE_LeafChamber.jpg ( 2017-08-01 13:51:15 ) Full size: 1080x1920
Kyle using the LI-6400 with a transparent leaf chamber
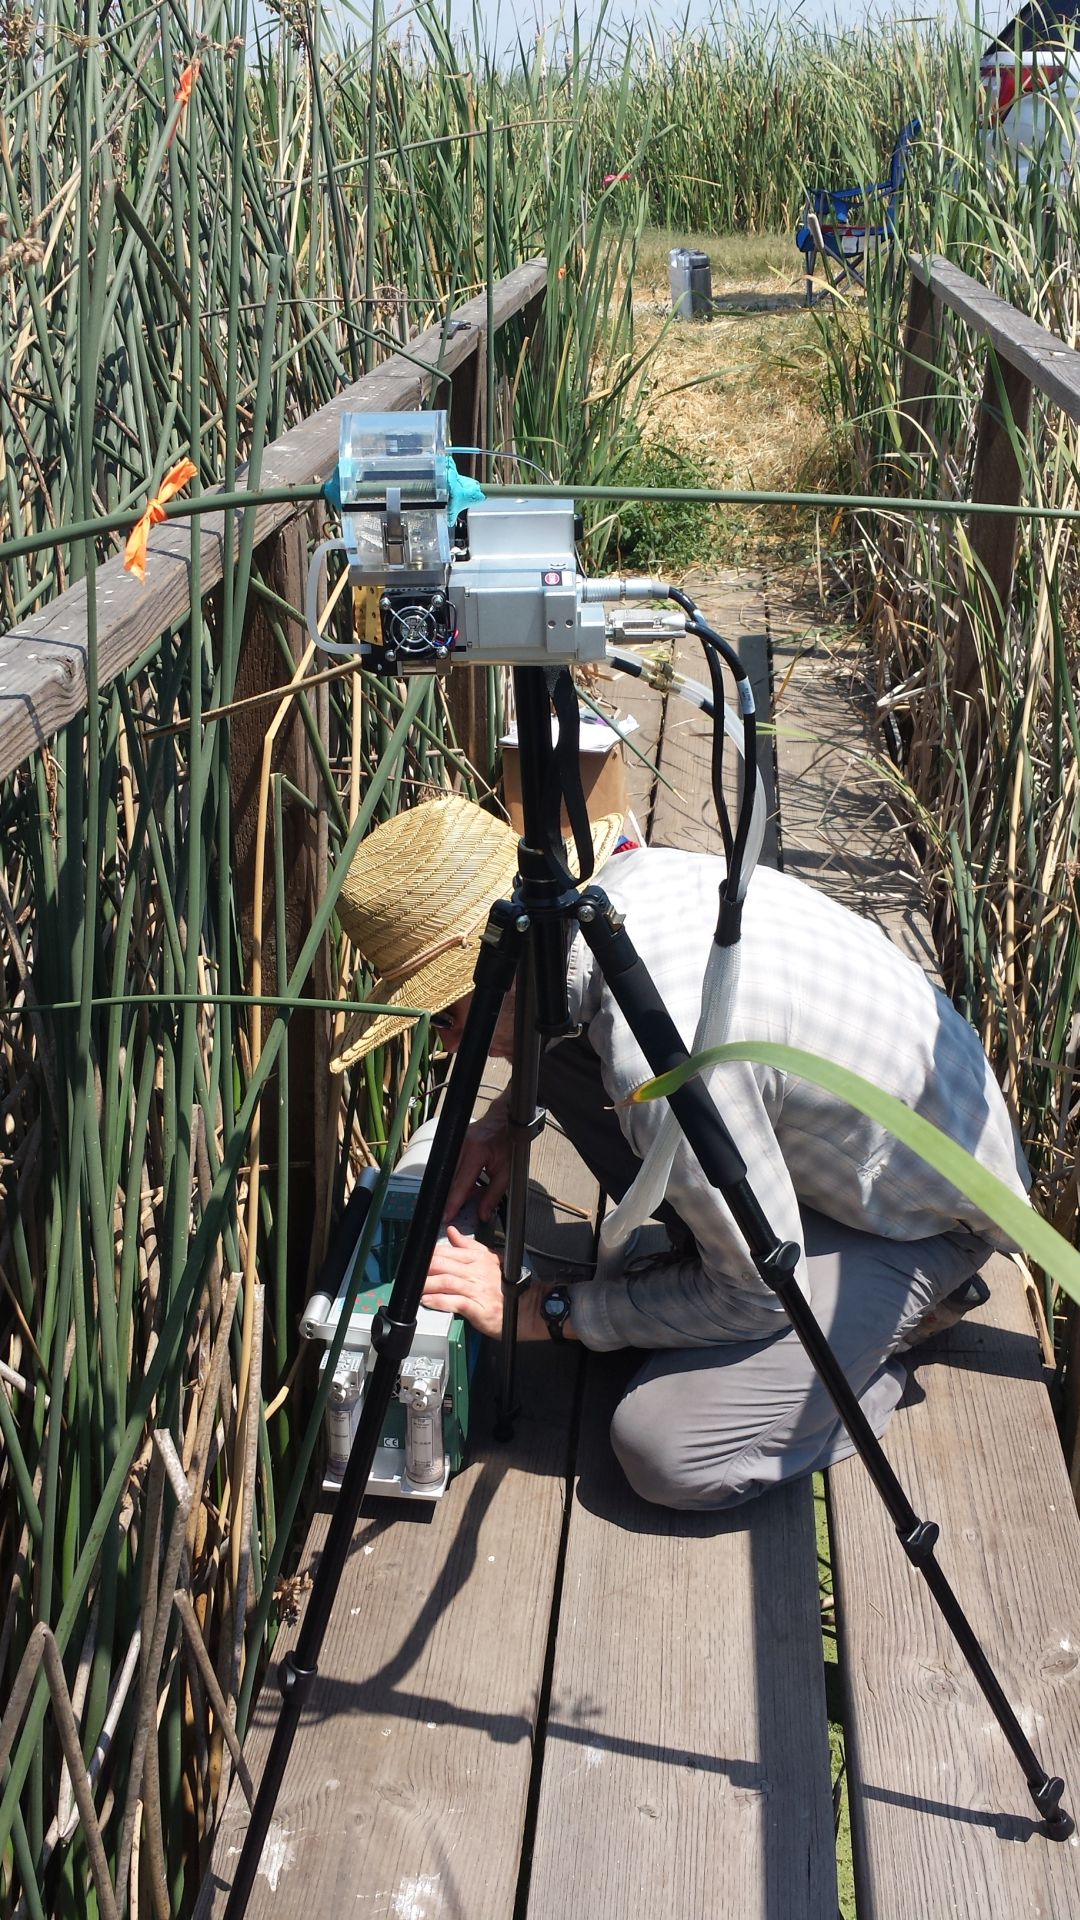
20170801EE_LeafKyle.jpg ( 2017-08-01 13:51:07 ) Full size: 1080x1920
Kyle using the LI-6400 with a transparent leaf chamber
11 sets found
14 EE_met graphs found
Can't check EE_mixed
1 EE_mixed graphs found
8 EE_flux graphs found
Can't check MBWPEESWGT_mixed
1 EE_cam graphs found
Can't check MBEEWPSWEPGT_cam
Can't check SIMBTWEE_met
Can't check EE_Temp
5 EE_Temp graphs found
Can't check EE_minidot
1 EE_minidot graphs found
Can't check MBSWEEWPBCBA
1 EE_processed graphs found