
Field Notes
<--2017-02-14 10:15:00 | 2017-03-08 11:40:00-->Other sites visited today: East End | West Pond | Sherman Wetland
Phenocam link: Searching...
Mayberry: 2017-02-23 10:17:00 (DOY 54)
Author: Daphne Szutu
Others: Joe Verfaillie
Summary: Installed additional 1 miniDOT sensor and 2 eosense CO2 sensors, new boom for water sensors, regular data collection/cleaning
| We arrived around 10:15. It was sunny, windy and cool, with clouds over the Sierras. The water level was higher than before. I switched the Rnet wires so that the daytime max values are positive. Joe installed a new boom for the water sensors (miniDOT and eosense CO2) and deployed additional sensors. This new boom allows us to access the sensors without getting in the water. The water depth at the sensors is 80 cm and the sensors are co-located in one vertical profile. There are now 3 miniDOTs deployed: sn 1221: top position, z = 8 cm (reinstalled) sn 1220: middle position, z = 38 cm sn 1219: bottom position, z = 68 cm There are now 3 eosense CO2 probes deployed: sn GP20150111: bottom position, z = 68 cm sn GP20160069: middle position, z = 38 cm sn GP20170070: top position, z - 8 cm All the miniDOTs and eosense probes have new copper screens. The miniDOTs have new dessicant. We did not check the time on the miniDOTs b/c we couldn't connect the software to the probes. The water reservoir was still full so I did not refill. There was many wasps in the box. I downloaded the met, USG GHG, and camera data, and cleaned the EC and radiation sensors. I also downloaded the HOBO conductivity sensor and cleaned the Campbell Sci conductivity probe orifice. The orifice was muddy and wormy. LI7500 readings: CO2 413.89 umol/mol H2O 269.7 mmol/m3 T 11.1 Celsius P 102.3 kPa SS 103.2 -> 103.3 LI7700 readings: CH4: 1.95 RSSI: 61.3 -> 79.6 after cleaning We need a bolt for the radiometer boom and a 6/32 screw for the bottom miniDOT. |
1 photos found
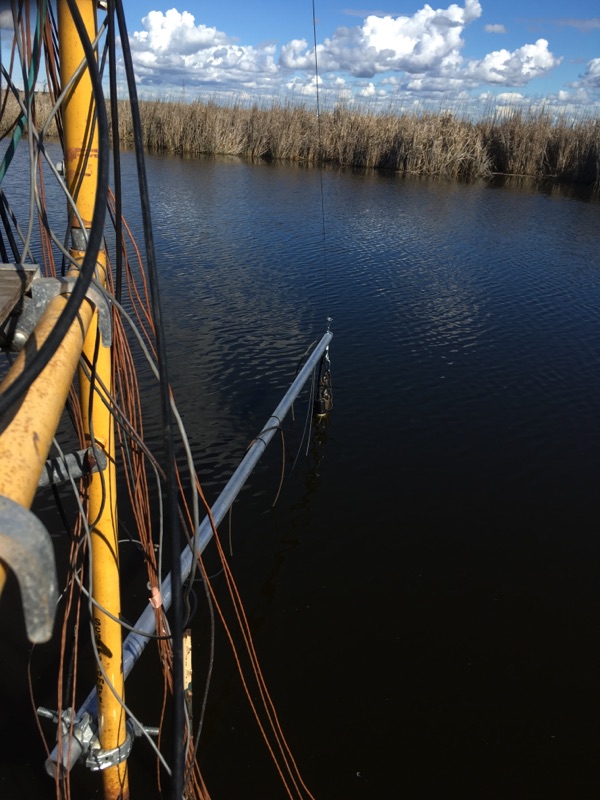
20170223MB_boom.jpg ( 2017-02-23 00:00:00 ) Full size: 600x800
New boom hanging off of the tower so can service the water sensors without getting in the water. This is a fixed height boom. Currently has 3 miniDOTs at -8, -38, and -68cm relative to the water surface. There are also 3 eosGP probes at the same depths.
11 sets found
7 MB_flux graphs found
No data found for MB_met.
28 MB_tule graphs found
Can't check MBWPEESWGT_mixed
1 MB_cam graphs found
Can't check MBEEWPSWEPGT_cam
Can't check SIMBTWEE_met
1 MB_minidot graphs found
Can't check MBSWEEWPBCBA
1 MB_processed graphs found
Can't check MB_fd
1 MB_fd graphs found