
Field Notes
<--2017-02-14 09:25:00 | 2017-03-01 13:40:00-->Other sites visited today: East End | West Pond | Mayberry
Phenocam link: Searching...
Sherman Wetland: 2017-02-23 09:05:00 (DOY 54)
Author: Daphne Szutu
Others: Joe Verfaillie
Summary: Installed conductivity probe, regular data collection/cleaning
| We arrived at 9:05. It was clear and sunny but windy and cold. The water was higher than before. The water at tower ~20 cm deep. 25cm from top of well pipe. We installed a conductivity probe. It is hanging by the southwest corner of the tower. The conductivity reading was about 2-3 mS/cm. I collected the met and USB GHG data. Joe reconnected the camera, but we weren't able to connect to it consistently through the computer, either through stardot tools or through telnet. We probably need a new ethernet connector at the camera. The wash reservoir was already mostly full and I topped it off. There were many sleepy wasps in the reservoir box. We checked the precip bucket and the funnel was clear. Joe cleaned the EC and radiation sensors. LI7500 readings: CO2 413.6 umol/mol H2O 305.6 mmol/m3 T 7.55 Celsius P 102.3 kPa SS 96.98 -> 97.05 LI7700 readings: CH4: 1.96 RSSI: 62.6 -> 86.4 after cleaning The HMP60 fan needs replacing and need a new ground wire for the datalogger box. We left at 10:05. |
2 photos found
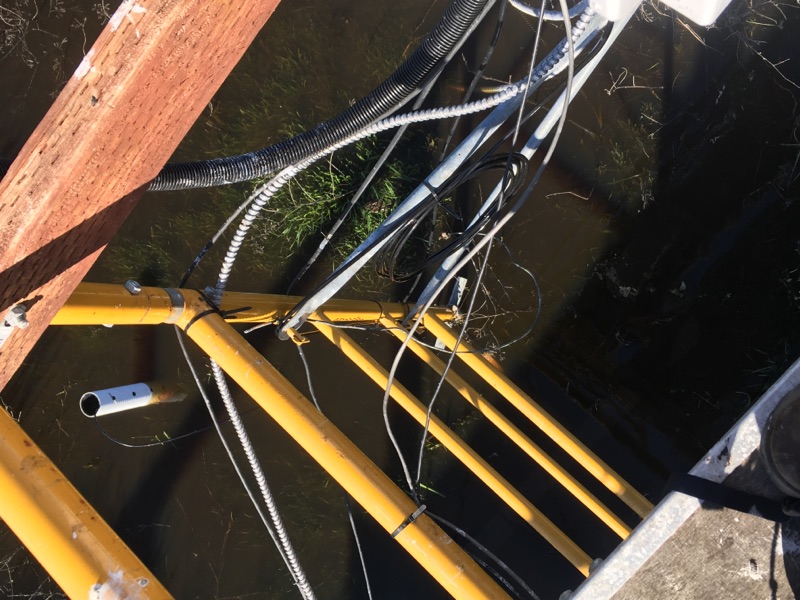
20170223SW_cond.jpg ( 2017-02-23 00:00:00 ) Full size: 800x600
Installed a conductivity probe in the open water off the southwest corner of the scaffolding. No vegetation yet around the tower.
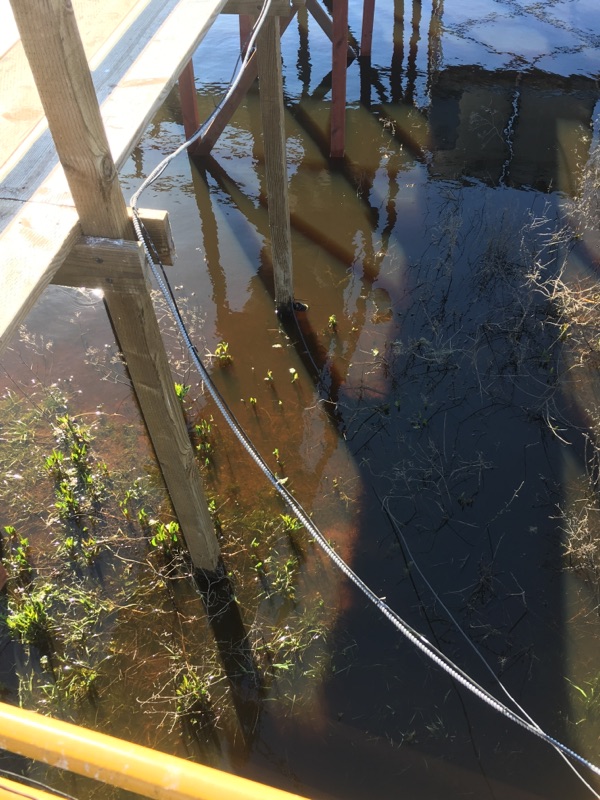
20170223SW_waterlevel.jpg ( 2017-02-23 00:00:00 ) Full size: 600x800
Dissolved CO2 eosGP probe is tied to one of the boardwalk legs
7 sets found
Can't check MBWPEESWGT_mixed
Can't check MBEEWPSWEPGT_cam
15 SW_met graphs found
4 SW_flux graphs found
Can't check MBSWEEWPBCBA
Can't check SW_Temp
14 SW_Temp graphs found
No data found for SW_arable.