
Field Notes
<--2016-10-20 10:00:00 | 2016-11-17 12:30:00-->Other sites visited today: Tonzi | Tonzi
Phenocam link: Searching...
Vaira: 2016-11-02 09:30:00 (DOY 307)
Author: Joe Verfaillie
Others: Siyan
Summary: Beautiful day, green grass, still some leaves on the trees, removed radiometer inter-comparison set, fixed data transfer, installed staff gauges at the pond.
| Vaira 2016-11-02 I arrived about 9:30 with Siyan. There was lots of Tule fog in the delta and central valley, but Varia is clear, sunny and warm with little to no wind. There has been more rain since last time and there are now small puddles on the road and the grass continues to grow turning the hills green. We stopped at the tower and Siyan did soil moisture, spectral measurements and took clip plots. I checked on the computer system. It was running, but I had to hard restart it to get the screen to come on. It collected data and images but wasn’t sending them. It seems the delay after enabling the modem was not long enough. I had shortened the delay to 10s here. Changing the delay to 30s allowed the system to make the SSH connection to campus and send all the queued files. I also cable tied the modem up near the fan where it seemed to get much better signal. I still need to do some major work to reorganize the box. I brought in the radiometer inter-comparison set. CR6 sn 1238 AM16/32 sn 2113 Hukseflux NR01 sn 1720 – old, scratched SW domes Hukseflux NR01 sn 2420 – New K&Z PAR sn 140457 - New I also cleaned the radiometers and dumped some bird poop out of the rain gauge. The rain gauge was missing its screen. Then we went to the pond to install staff gauges. The stream at the bottom of the dip had water in it this time and the pond may have been about 4in higher. Siyan cut the 2x6 redwood boards and 1†heavy conduit. I used a laser level to reference the new staff gauges to the existing PVC post which is marked in feet topping out at 22ft. I pounded 5ft lengths of the conduit about half way in and strapped 4ft lengths of the boards to the posts. I put in three of these and mounted gauges ranging from 20.4 to 23.7ft, 17.0 to 20.3ft and 13.6 to 16.8ft. I have a fourth gauge but it would have been completely underwater as the third gauge was already in the water. I may have to wait until next summer to put it in. The pond depth was 13.82feet. |
Veg Height (cm): Tape measure from ground to top of plant - Outside fenced area - grazed
7, 14, 8, 9, 10, avg = 9.6, stdev = 2.7
Field Data
No tank data
Well Depth
| Date | Location | Depth (feet) |
|---|---|---|
| 2016-11-02 | TZ_floor | 30.2 |
| 2016-11-02 | TZ_road | 38.1 |
| 2016-11-02 | TZ_tower | 34.7 |
mode = both
Moisture Point Probes TZ
Array
(
[0] => Floor_South_1
[1] => Floor_East_1
[2] => Floor_West_1
[3] => SoilCO2_1
[4] => Soil_Transect_4_1
[5] => Soil_Transect_3_1
[6] => Soil_Transect_2_1
[7] => Soil_Transect_1_1
[8] => SoilCO2_West_A_1
[9] => SoilCO2_West_B_1
[10] => SoilCO2_West_C_1
[11] => Floor_South_2
[12] => Floor_East_2
[13] => Floor_West_2
[14] => SoilCO2_2
[15] => Soil_Transect_4_2
[16] => Soil_Transect_3_2
[17] => Soil_Transect_2_2
[18] => Soil_Transect_1_2
[19] => SoilCO2_West_A_2
[20] => SoilCO2_West_B_2
[21] => SoilCO2_West_C_2
[22] => Floor_South_3
[23] => Floor_East_3
[24] => Floor_West_3
[25] => SoilCO2_3
[26] => Soil_Transect_4_3
[27] => Soil_Transect_3_3
[28] => Soil_Transect_2_3
[29] => Soil_Transect_1_3
[30] => SoilCO2_West_A_3
[31] => SoilCO2_West_B_3
[32] => SoilCO2_West_C_3
[33] => Floor_South_4
[34] => Floor_East_4
[35] => Floor_West_4
[36] => SoilCO2_4
[37] => Soil_Transect_4_4
[38] => Soil_Transect_3_4
[39] => Soil_Transect_2_4
[40] => Soil_Transect_1_4
[41] => SoilCO2_West_A_4
[42] => SoilCO2_West_B_4
[43] => SoilCO2_West_C_4
)
| Date | DOY | Rep | Depth | Floor_South_1 |
Floor_East_1 |
Floor_West_1 |
SoilCO2_1 |
Soil_Transect_4_1 |
Soil_Transect_3_1 |
Soil_Transect_2_1 |
Soil_Transect_1_1 |
SoilCO2_West_A_1 |
SoilCO2_West_B_1 |
SoilCO2_West_C_1 |
Floor_South_2 |
Floor_East_2 |
Floor_West_2 |
SoilCO2_2 |
Soil_Transect_4_2 |
Soil_Transect_3_2 |
Soil_Transect_2_2 |
Soil_Transect_1_2 |
SoilCO2_West_A_2 |
SoilCO2_West_B_2 |
SoilCO2_West_C_2 |
Floor_South_3 |
Floor_East_3 |
Floor_West_3 |
SoilCO2_3 |
Soil_Transect_4_3 |
Soil_Transect_3_3 |
Soil_Transect_2_3 |
Soil_Transect_1_3 |
SoilCO2_West_A_3 |
SoilCO2_West_B_3 |
SoilCO2_West_C_3 |
Floor_South_4 |
Floor_East_4 |
Floor_West_4 |
SoilCO2_4 |
Soil_Transect_4_4 |
Soil_Transect_3_4 |
Soil_Transect_2_4 |
Soil_Transect_1_4 |
SoilCO2_West_A_4 |
SoilCO2_West_B_4 |
SoilCO2_West_C_4 |
Avg | Spacial Count |
Measurement Count |
|---|---|---|---|---|---|---|---|---|---|---|---|---|---|---|---|---|---|---|---|---|---|---|---|---|---|---|---|---|---|---|---|---|---|---|---|---|---|---|---|---|---|---|---|---|---|---|---|---|---|---|
| 2016-11-02 | 307 | 0 | nan | 24.4 | 28.2 | 26.1 | 31.4 | 25.3 | 22.3 | 25.8 | 22.3 | 27 | 25.8 | 25.83 | 37.1 | 43.2 | 31.3 | 31 | 25.8 | 32.6 | 31.4 | 17 | 26.1 | 21.6 | 30.1 | 42.4 | 54.1 | 36 | 36.6 | 30.4 | 32.1 | 33.5 | 25.1 | 34.3 | 36 | 36.3 | 54 | 50.9 | 41.7 | 42 | 35.4 | 45.1 | 49.1 | 11.6 | 45.4 | 52.6 | 51.7 | |||
| 2016-11-02 | 307 | 1 | nan | 23.2 | 29.4 | 27 | 30.8 | 22.3 | 25 | 22 | 25.8 | 24.7 | 6.1 | 37.8 | 44.5 | 31.9 | 32.3 | 25.9 | 31.9 | 30.4 | 17 | 26 | 21.9 | 30.4 | 42.1 | 56.1 | 35.4 | 38.5 | 31 | 32.7 | 32.7 | 25.1 | 34.9 | 34.9 | 36.3 | 62.2 | 49.7 | 42.3 | 41.4 | 35.7 | 45.4 | 48 | 11.6 | 45.7 | 50.3 | 49.1 | ||||
| 2016-11-02 | 307 | Avg | 0-15cm | 0 | 0 | |||||||||||||||||||||||||||||||||||||||||||||
| 2016-11-02 | 307 | Avg | 15-30cm | 0 | 0 | |||||||||||||||||||||||||||||||||||||||||||||
| 2016-11-02 | 307 | Avg | 30-45cm | 0 | 0 | |||||||||||||||||||||||||||||||||||||||||||||
| 2016-11-02 | 307 | Avg | 45-60cm | 0 | 0 |
mode = both
Moisture Point Probes VR
Array
(
[0] => Solar_Panels_1
[1] => Flux_Tower_1
[2] => Gate_1
[3] => Biomass_Cage_1
[4] => Solar_Panels_2
[5] => Flux_Tower_2
[6] => Gate_2
[7] => Biomass_Cage_2
[8] => Solar_Panels_3
[9] => Flux_Tower_3
[10] => Gate_3
[11] => Biomass_Cage_3
[12] => Solar_Panels_4
[13] => Flux_Tower_4
[14] => Gate_4
[15] => Biomass_Cage_4
)
| Date | DOY | Rep | Depth | Solar_Panels_1 |
Flux_Tower_1 |
Gate_1 |
Biomass_Cage_1 |
Solar_Panels_2 |
Flux_Tower_2 |
Gate_2 |
Biomass_Cage_2 |
Solar_Panels_3 |
Flux_Tower_3 |
Gate_3 |
Biomass_Cage_3 |
Solar_Panels_4 |
Flux_Tower_4 |
Gate_4 |
Biomass_Cage_4 |
Avg | Spacial Count |
Measurement Count |
|---|---|---|---|---|---|---|---|---|---|---|---|---|---|---|---|---|---|---|---|---|---|---|
| 2016-11-02 | 307 | 0 | nan | 29.5 | 22.6 | 22.6 | 11.8 | 30.8 | 29.2 | 21.6 | 24.6 | 31.2 | 15.7 | 24.8 | 31.8 | 44.5 | 31.1 | 24.8 | 33.4 | |||
| 2016-11-02 | 307 | 1 | nan | 25.8 | 22.6 | 22.9 | 11.5 | 31 | 29.5 | 22.2 | 25.5 | 31.3 | 15.4 | 24.8 | 31.8 | 45.1 | 31.1 | 25.6 | 33.1 | |||
| 2016-11-02 | 307 | Avg | 0-15cm | 0 | 0 | |||||||||||||||||
| 2016-11-02 | 307 | Avg | 15-30cm | 0 | 0 | |||||||||||||||||
| 2016-11-02 | 307 | Avg | 30-45cm | 0 | 0 | |||||||||||||||||
| 2016-11-02 | 307 | Avg | 45-60cm | 0 | 0 |
No TZ grass heigth found
Grass Height VR 5
| Date | Height reps (cm) | Location | Average | Samp | STDEV | ||||
|---|---|---|---|---|---|---|---|---|---|
| 2016-11-02 | 7 | 14 | 8 | 9 | 10 | GH_ALL | 9.6 | 5 | 2.42 |
No VR Tree DBH found
No water potential data found
No VR Grass Biomass data found
No VR OakLeaves Biomass data found
No VR PineNeedles Biomass data found
6 photos found
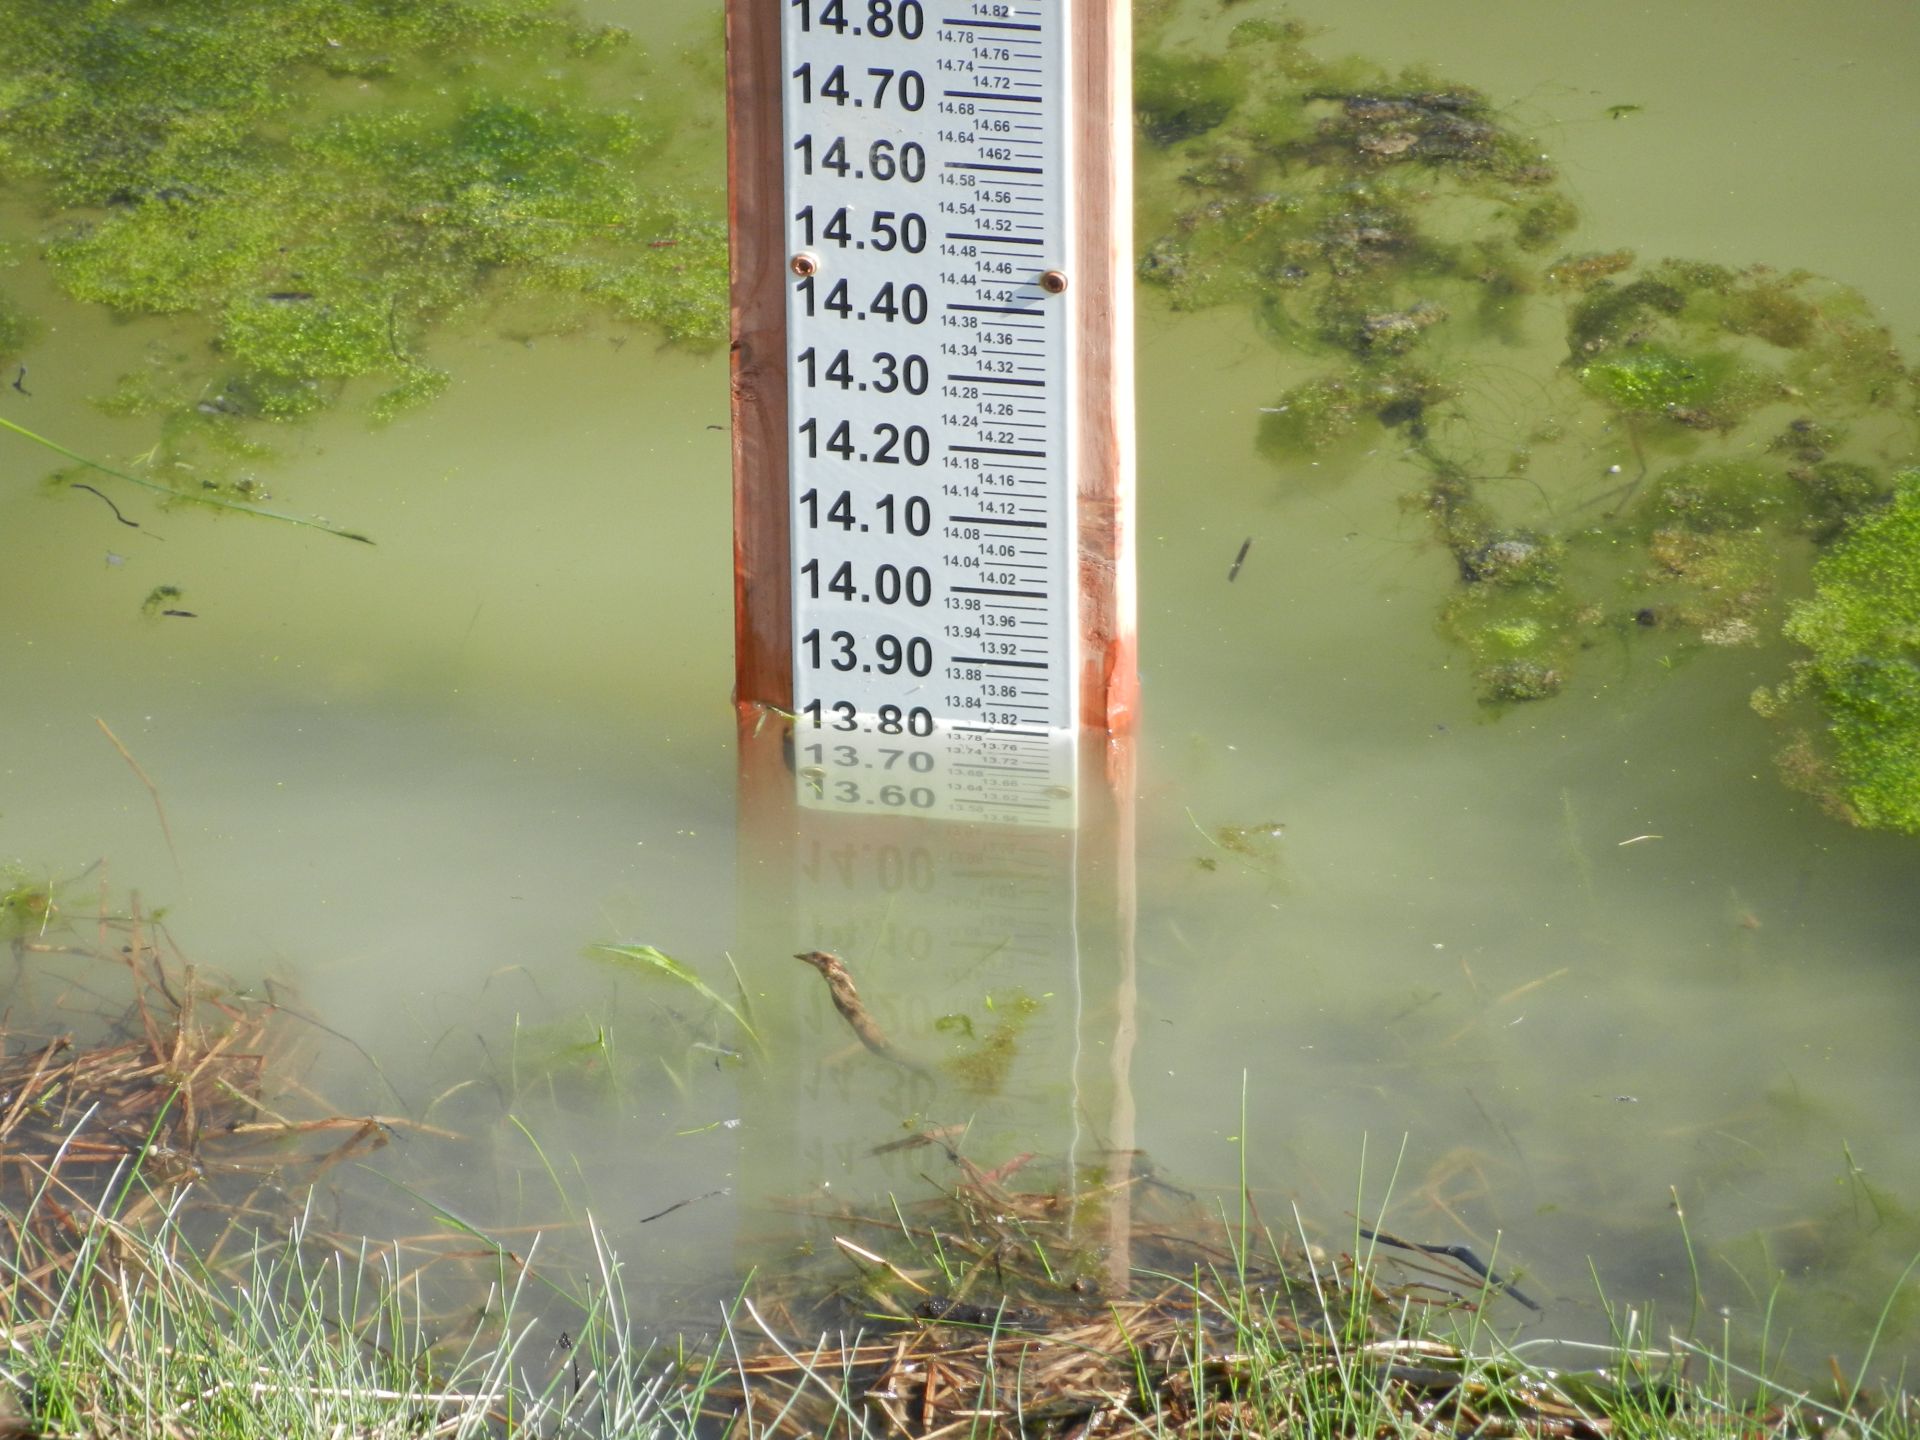
20161102VR_PondLevel.jpg ( 2016-11-02 12:01:32 ) Full size: 1920x1440
Installed staff gauges at the large pond northeast of our tower site to monitor the water level
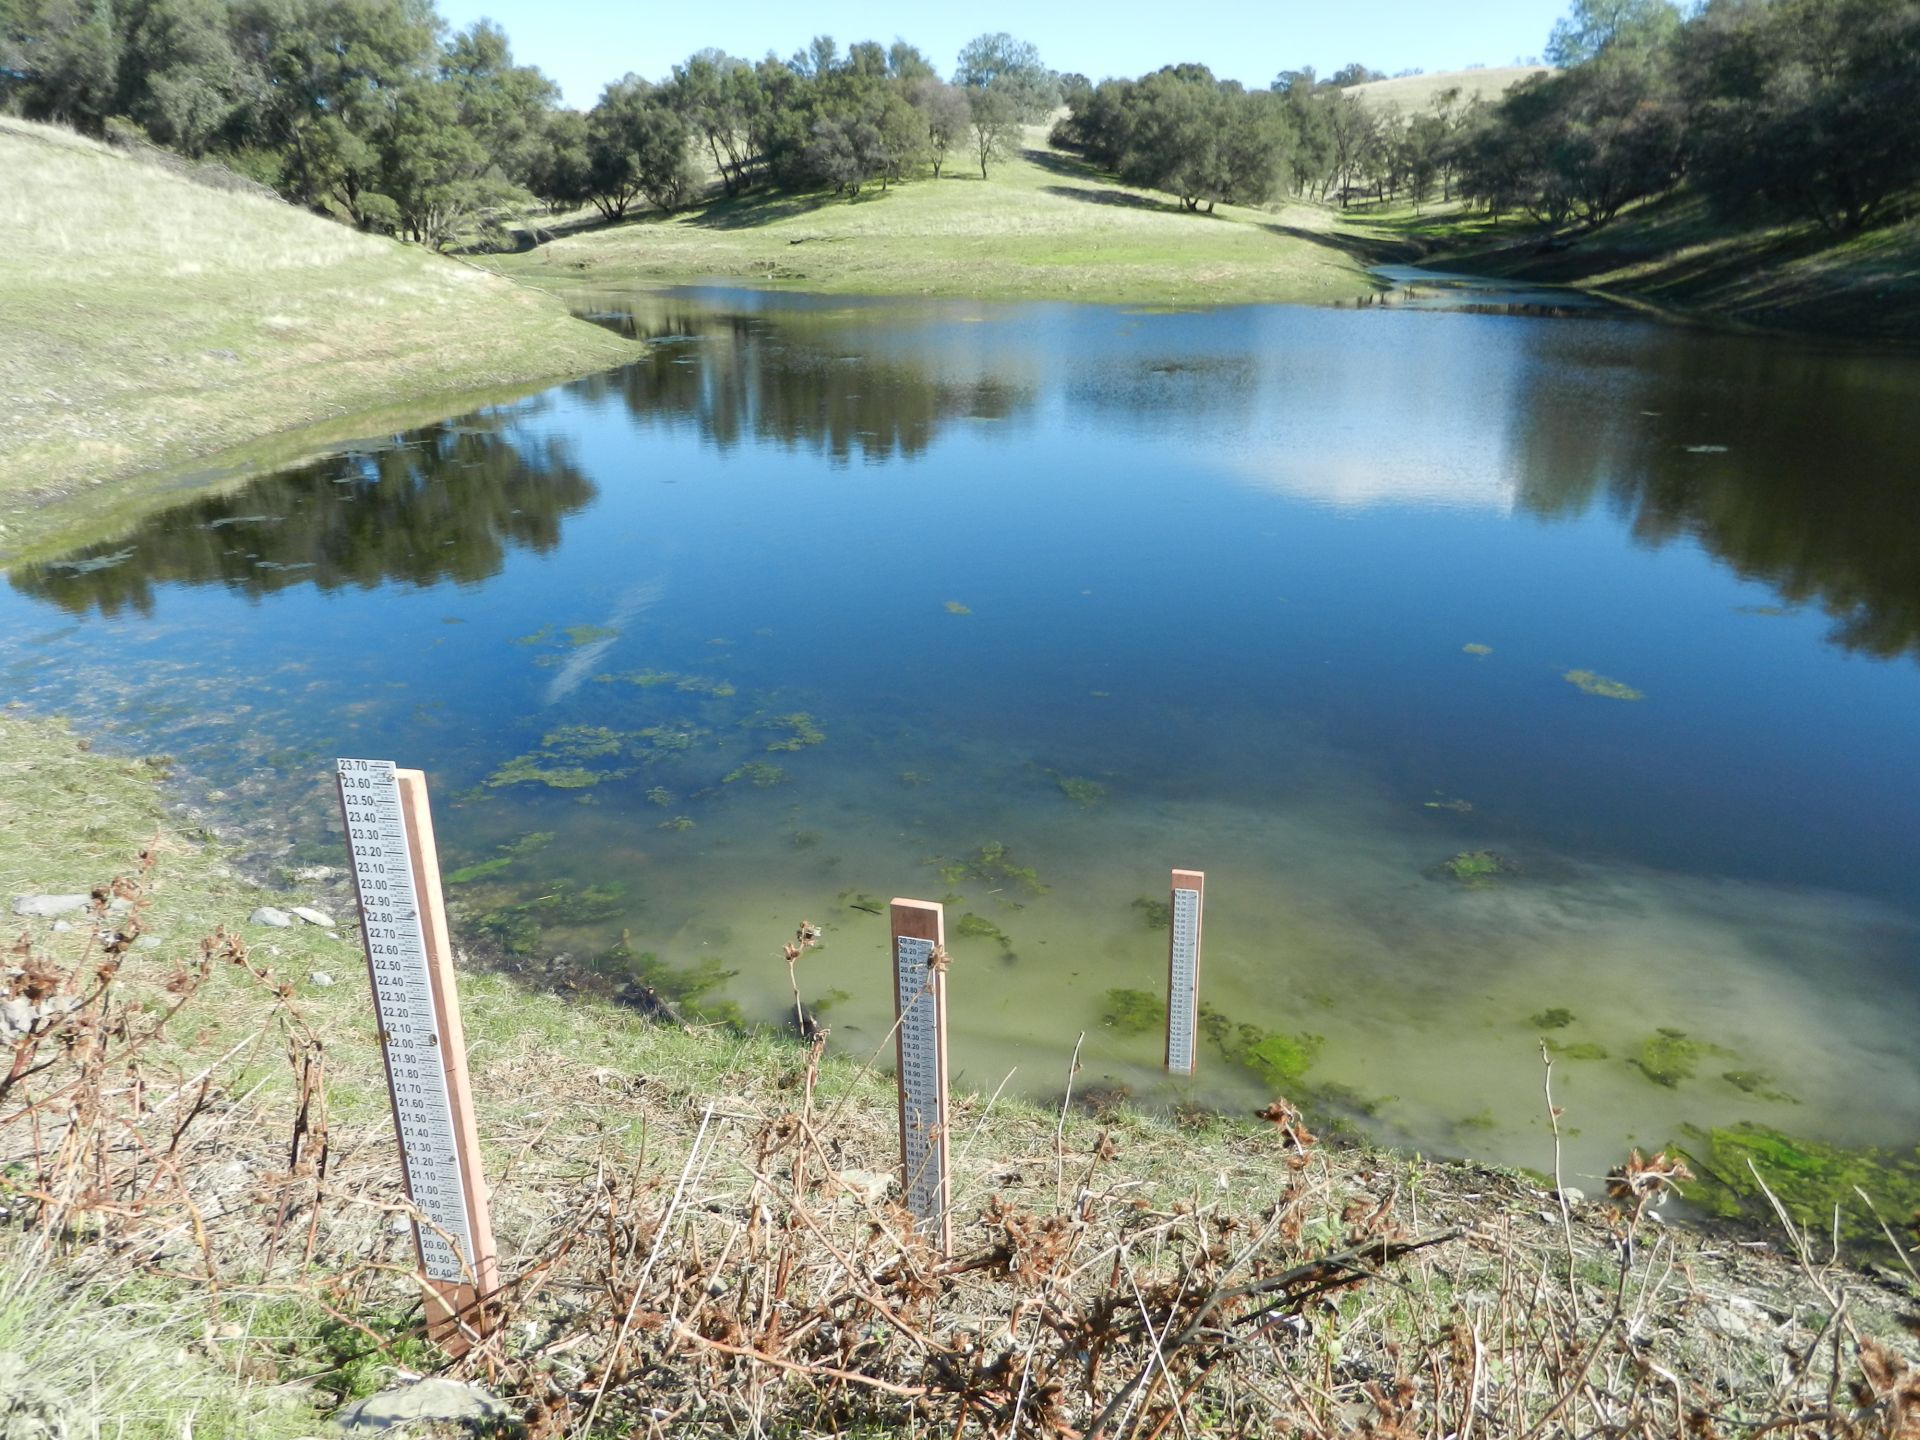
20161102VR_StaffGauges.jpg ( 2016-11-02 12:02:00 ) Full size: 1920x1440
Set of three gauges to monitor the water level in the large pond northeast of our tower site
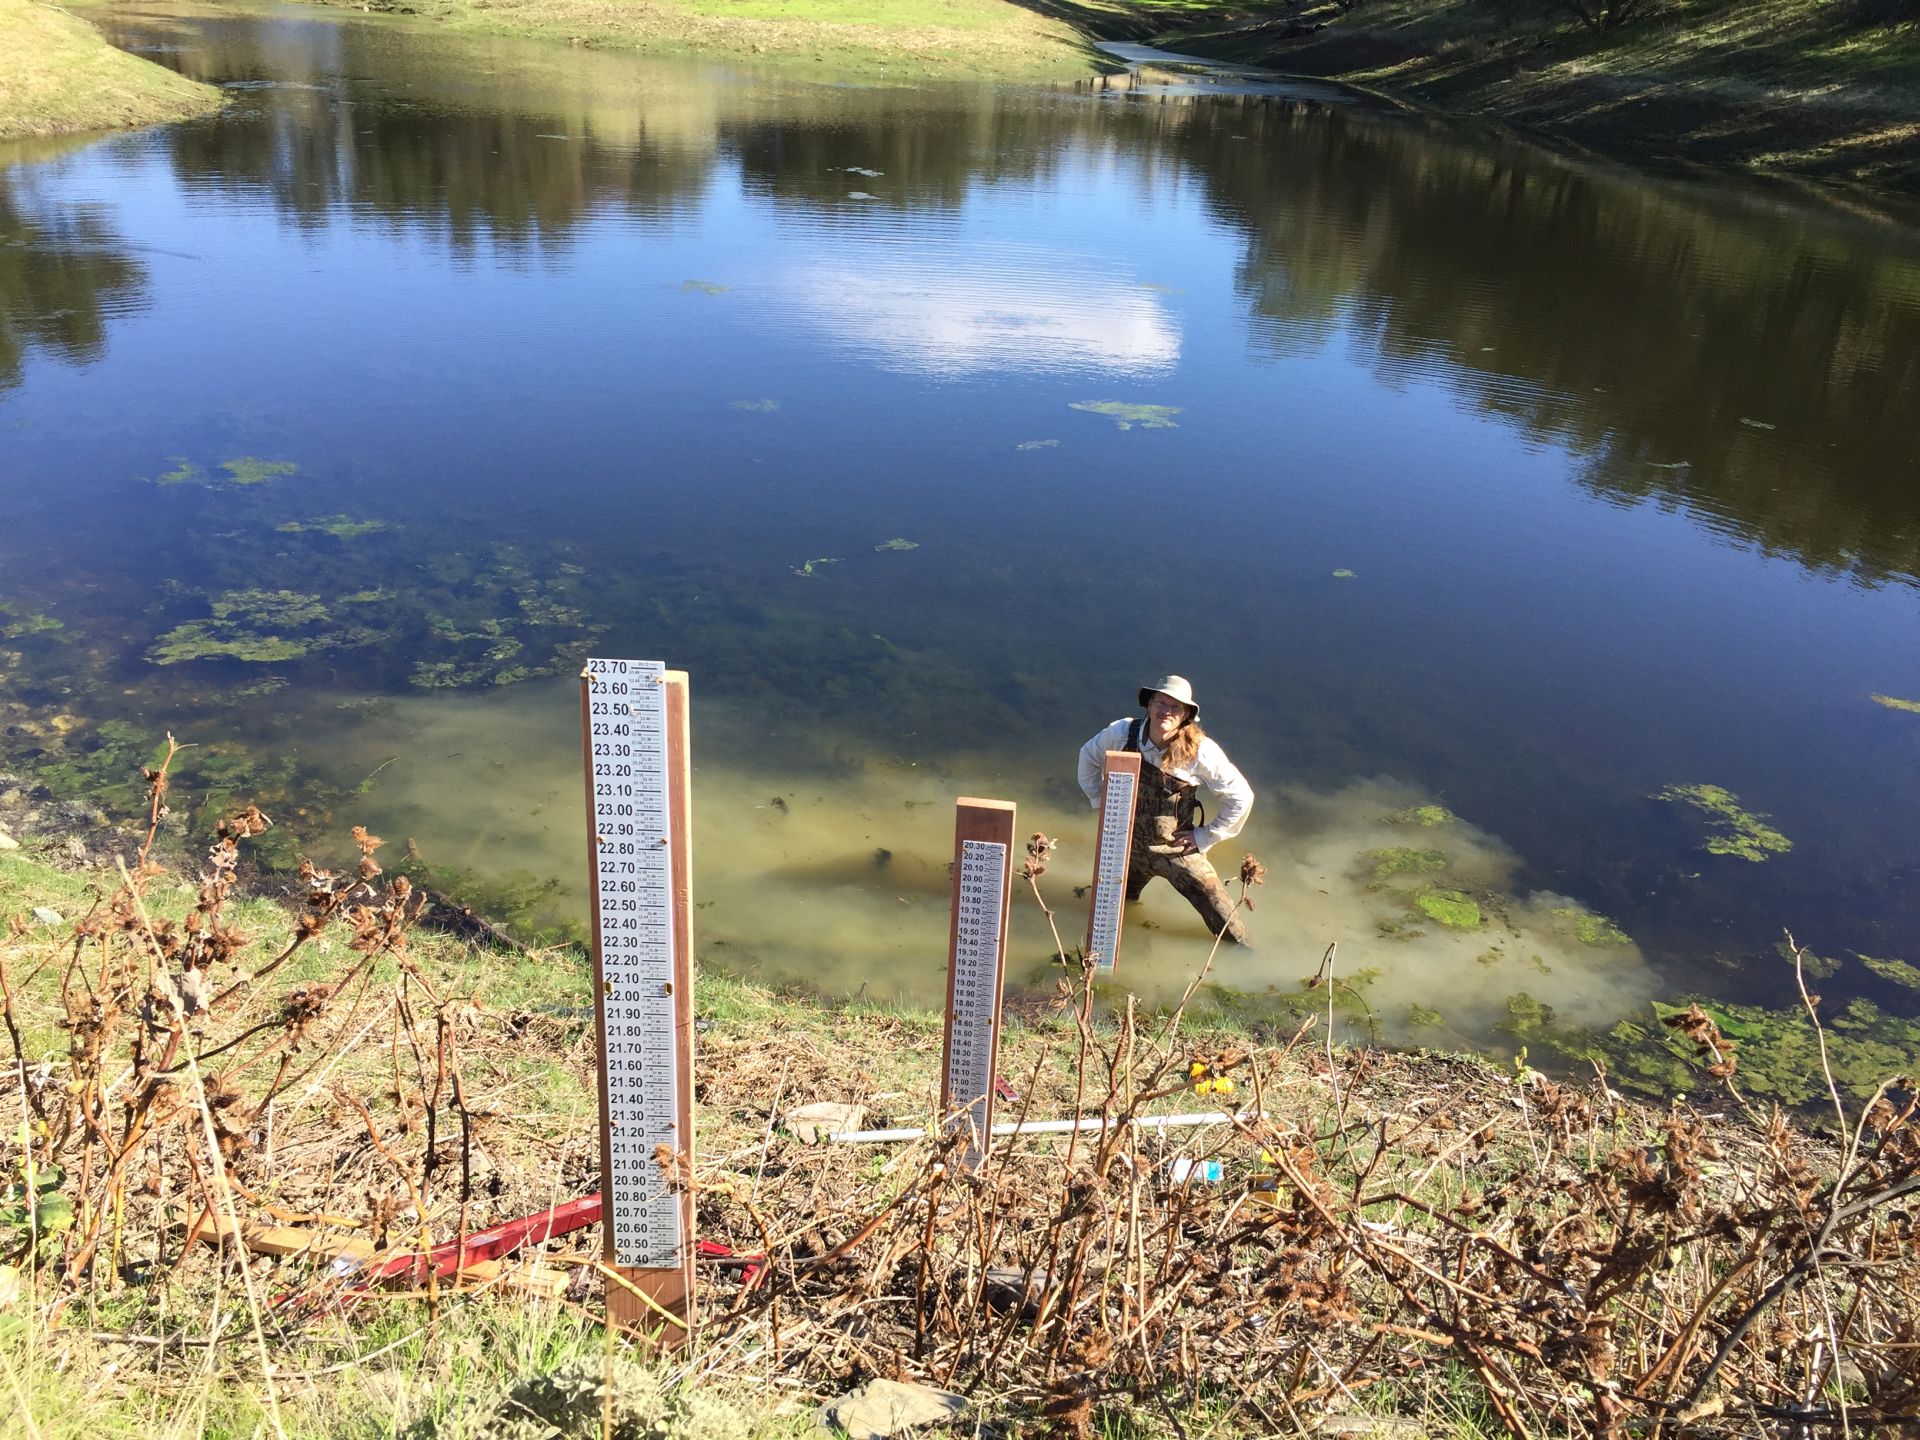
20161102VR_PondJoe.jpg ( 2016-11-02 11:33:28 ) Full size: 1920x1440
Set of three gauges (and Joe!) to monitor the water level in the large pond northeast of our tower site
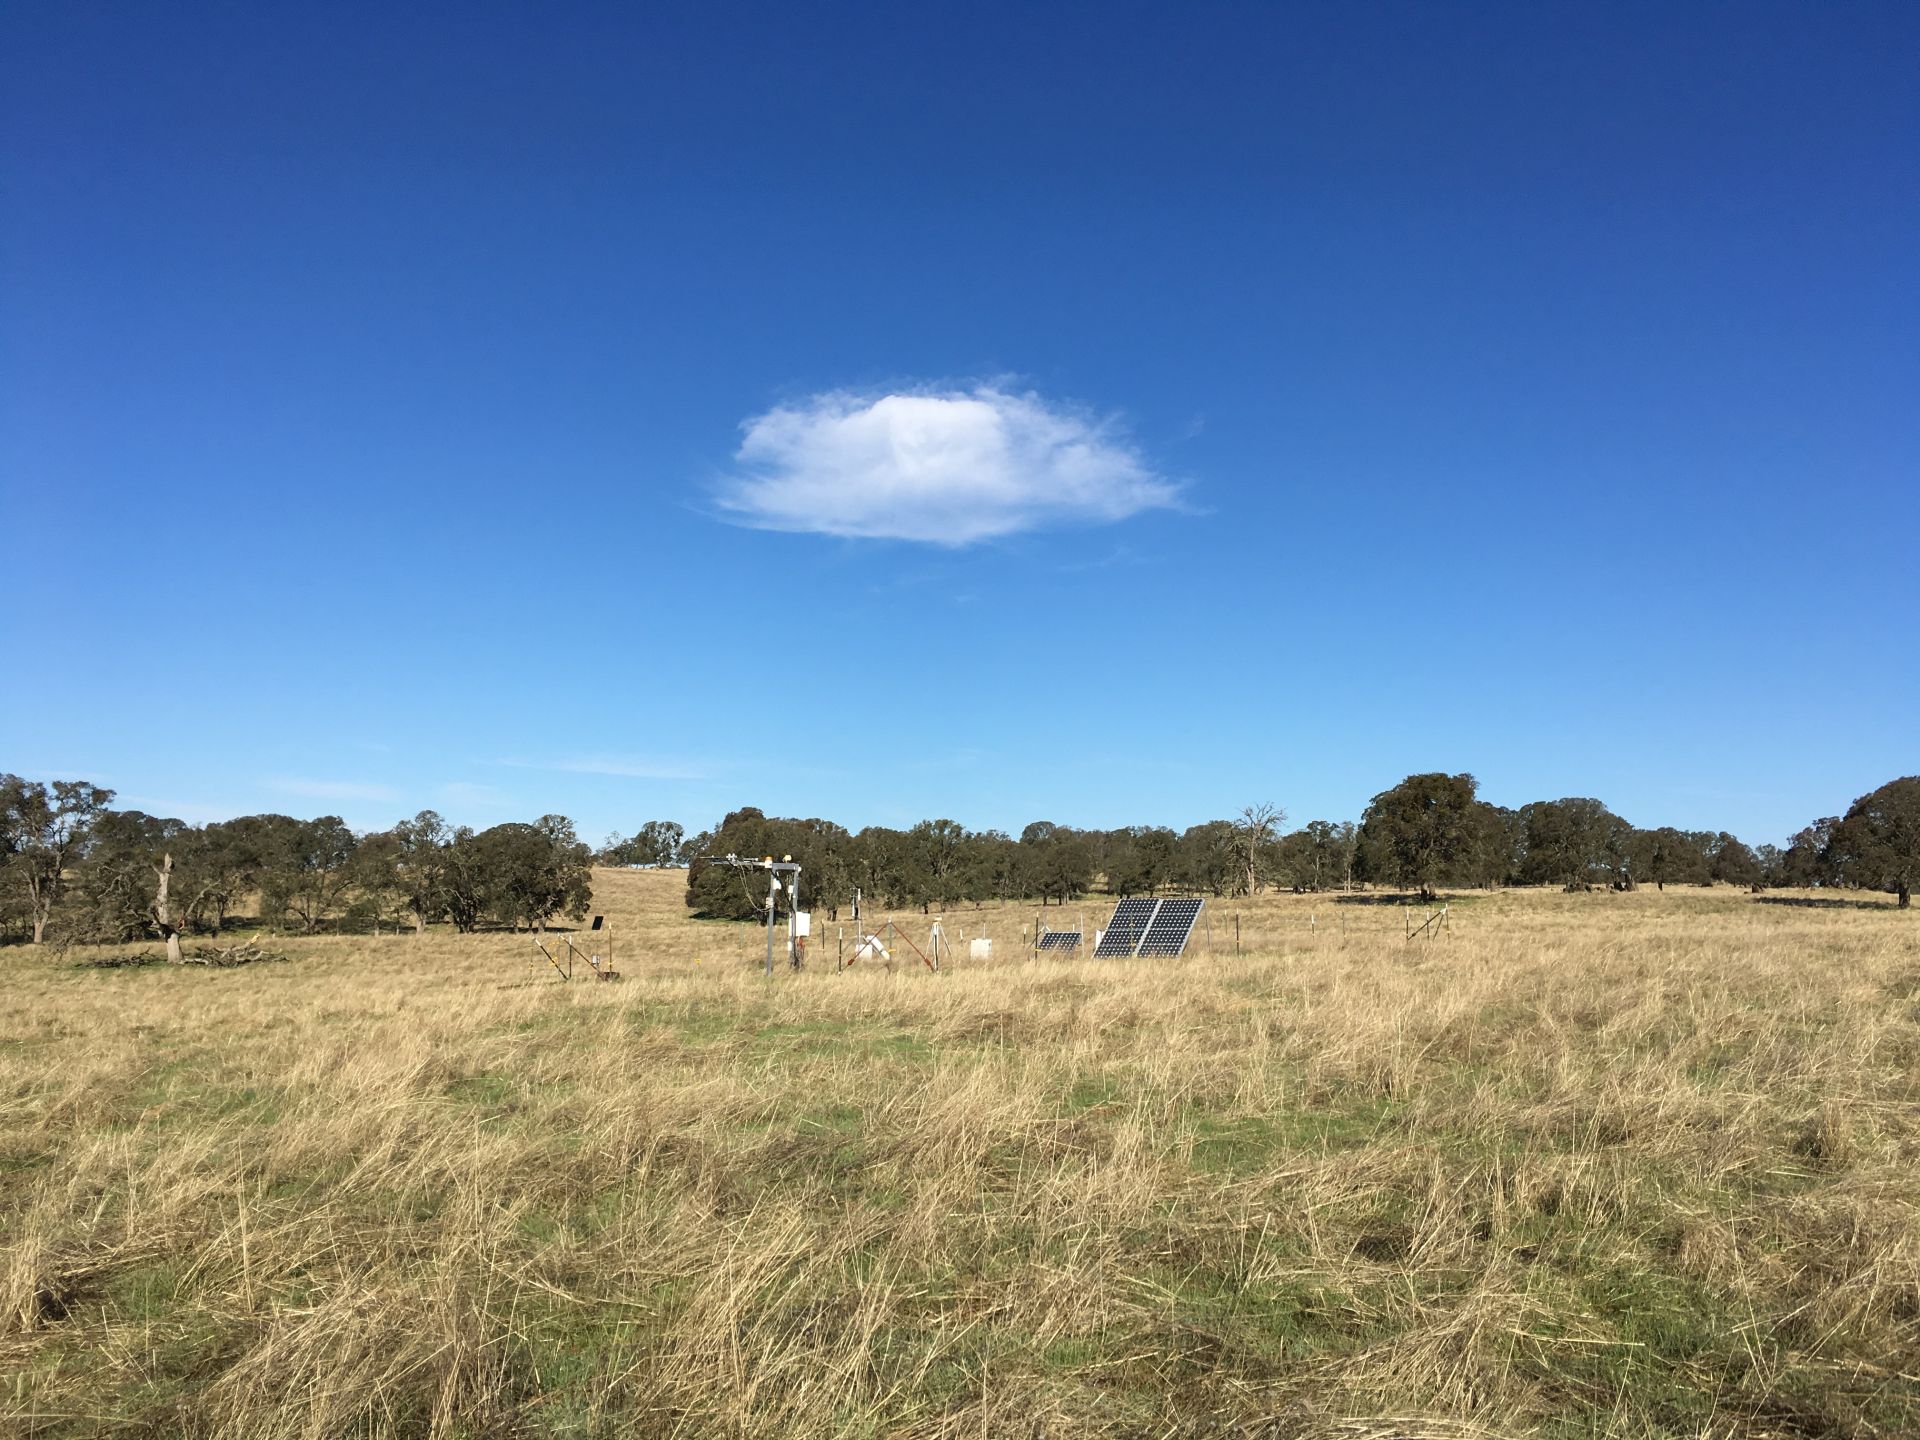
20161102VR_SiteCloud.jpg ( 2016-11-02 10:07:37 ) Full size: 1920x1440
Single cloud over half green, half brown field
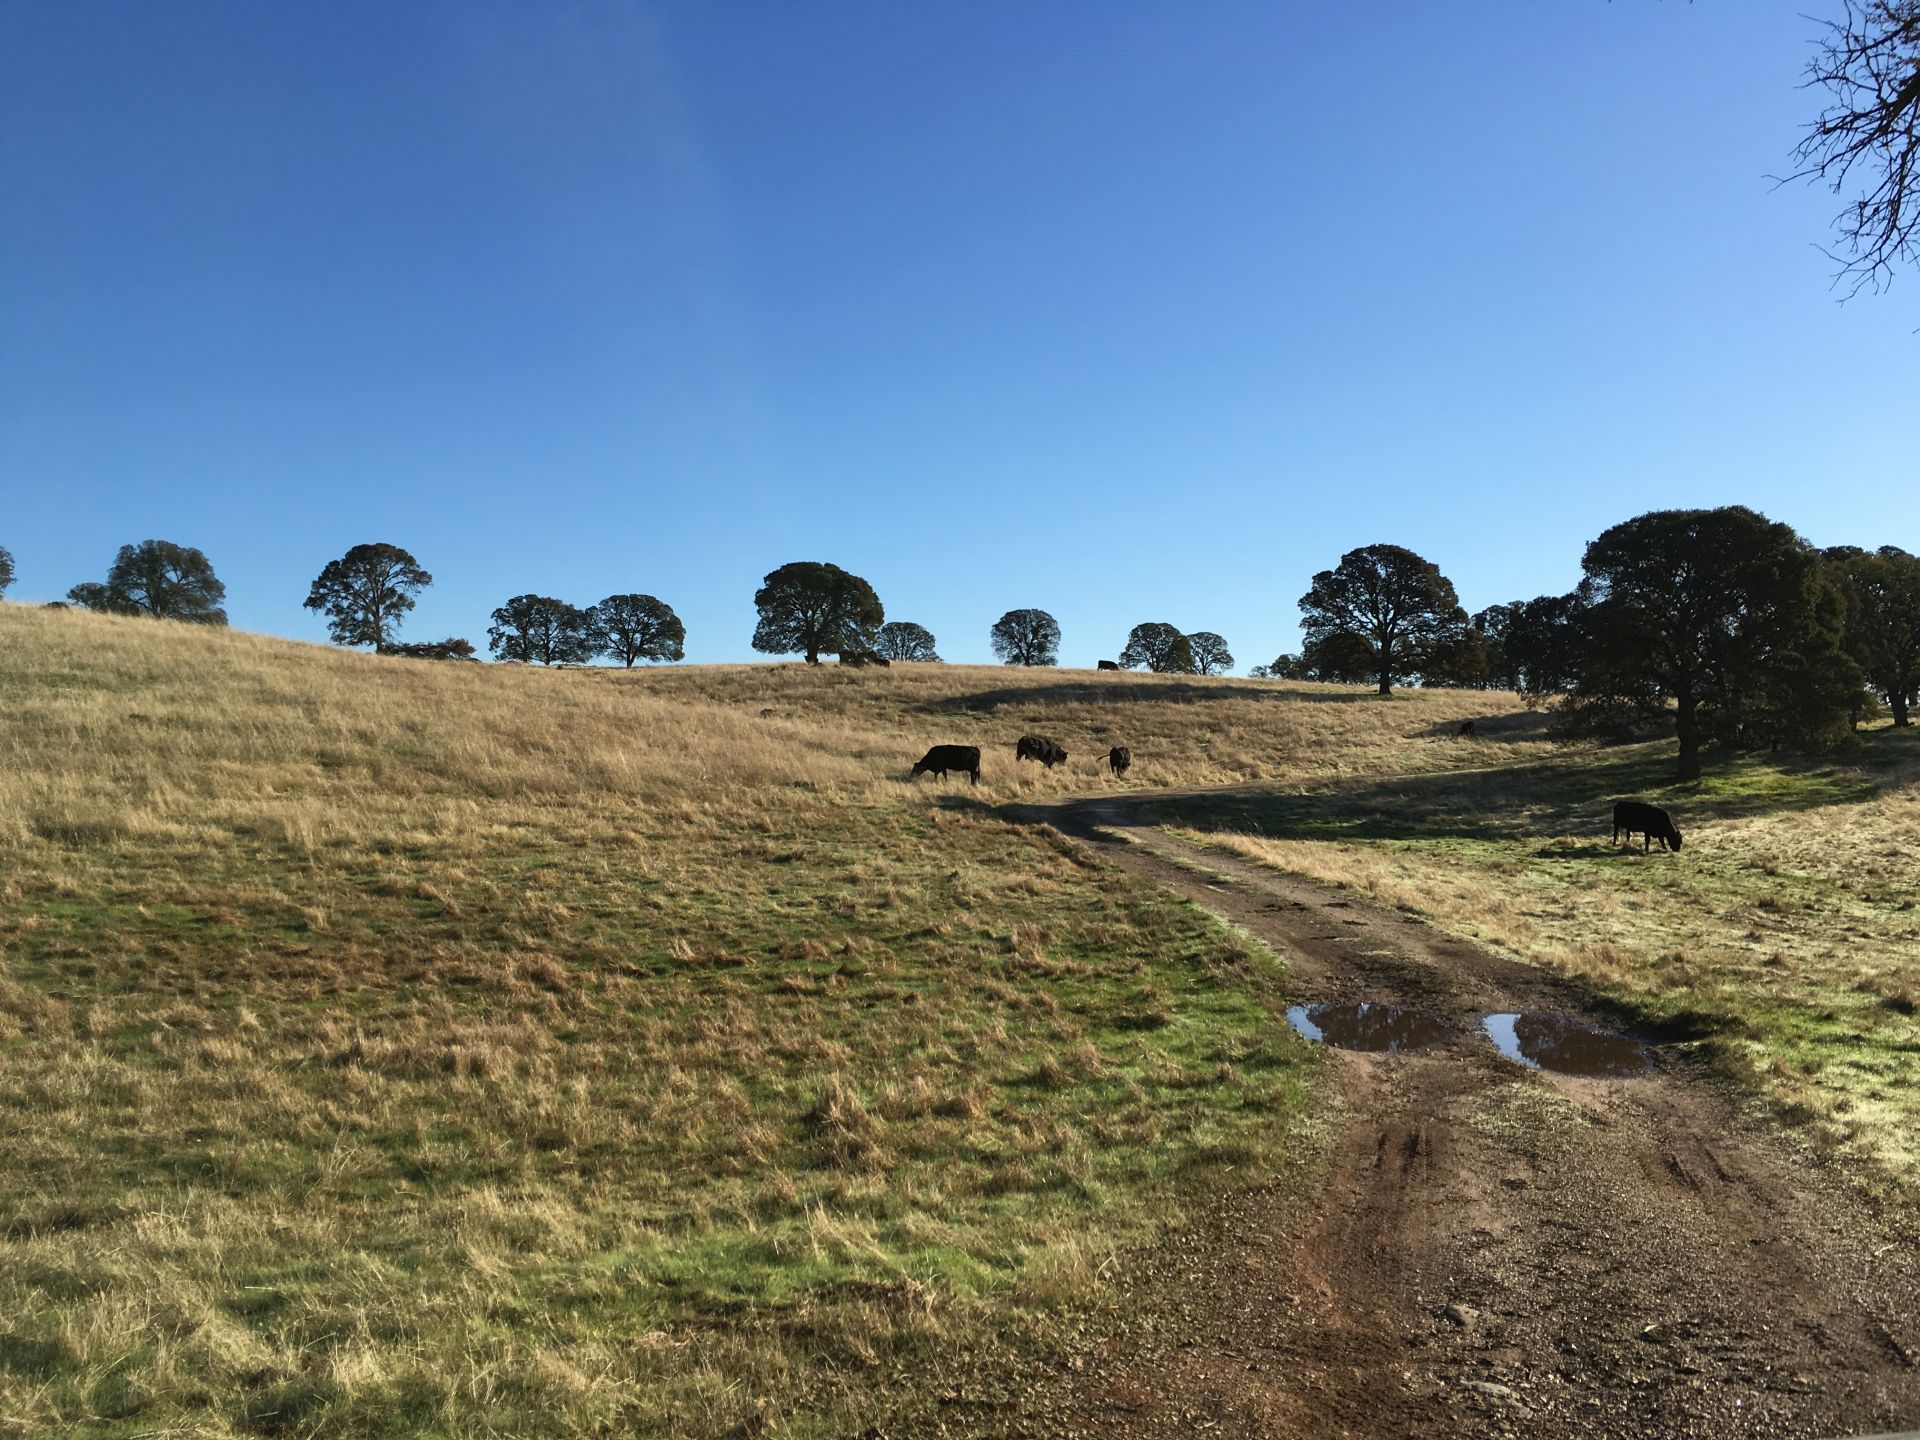
20161102VR_CowsTrees.jpg ( 2016-11-02 09:13:49 ) Full size: 1920x1440
Small puddles on the road and grazing cows
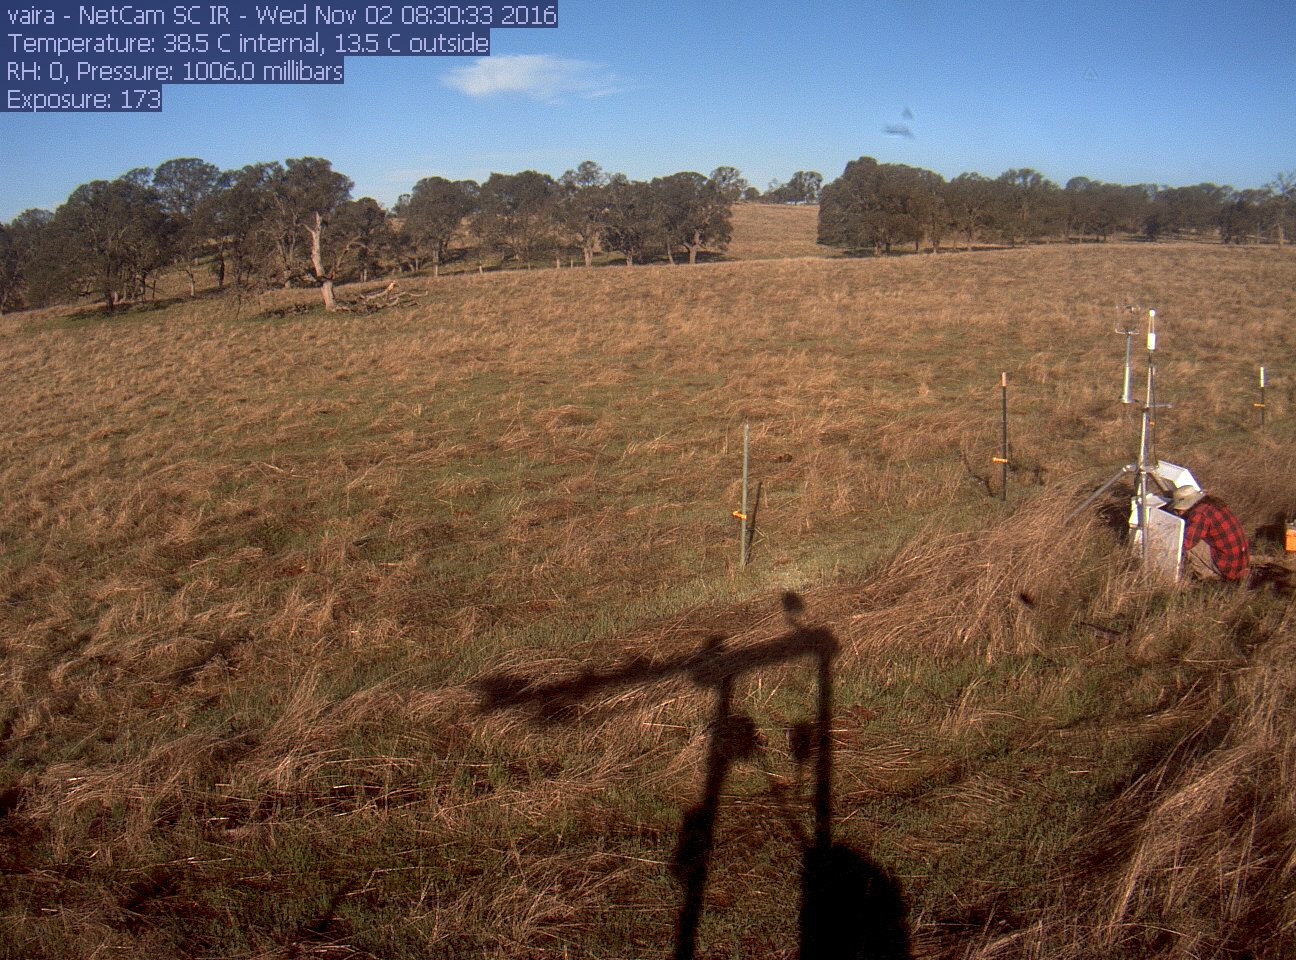
vaira_2016_11_02_083101.jpg ( 2016-11-02 07:28:32 ) Full size: 1296x960
Joe on site
9 sets found
16 VR_met graphs found
2 VR_flux graphs found
6 VR_soilco2 graphs found
No data found for VR_pond.
Can't check TZVR_mixed
No data found for VR_fd.
No data found for VR_processed.
No data found for VR_arable.
No data found for VR_soilvue.