Field Notes

<--2016-10-13 10:30:00 | 2016-11-02 09:00:00-->
Other sites visited today: Vaira | Bouldin Alfalfa | Twitchell Rice
Phenocam link: Searching...

Tonzi: 2016-10-20 12:00:00 (DOY 294)
Author: Joe Verfaillie
Others: Dennis, Sam

Summary: Cleaned zcam windows checked on Tower HMP45s, spider webs on Tower eddy sensors.

Tonzi
2016-10-20

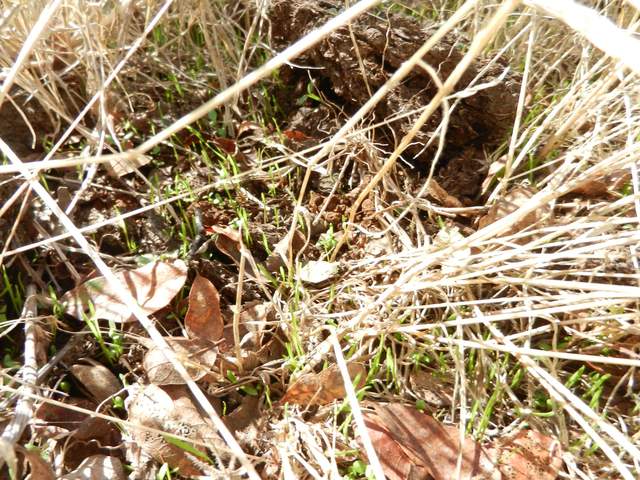
I arrived about 12 noon with Dennis and Sam. It was clear, sunny and warm. There was about 90mm of rain last Friday through Sunday, but the ground surface looks dry and there was no puddles I could see. The trees still have leaves. The grasses and herbs have sprouted and the grass is maybe a cm high.

Dennis tested AirT and RH with a sling pyschrometer
Floor: Tdry 26.5 C, Twet 18.0 C – calculated RH = 43.1%
Tower: Tdry 25.9 C, Twet 16.0 C – calculated RH = 34.5%
HMP45 Floor: Tair 23.68 C, RH 34.2%
HMP45 Tower: Tair 22.3 C, RH 38.42%

I checked on the Tower top HMP45. I don’t see any problems with it. We have some spare HMP60s in the lab. I think we will try an inter-comparison before we start swapping equipment.

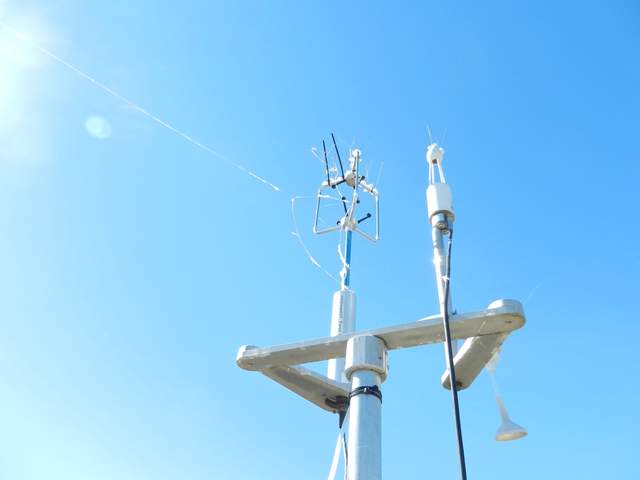
There was a bunch of spider webs on the eddy sensors. I lowered the post to clean them off.

I cleaned the zcam windows but they were pretty clean considering the rain.

Field Data

No tank data

No TZ Well data found

No TZ Moisture Point data found

No VR Moisture Point data found

No TZ grass heigth found

No VR grass heigth found

No TZ Tree DBH found

No water potential data found

No TZ Grass Biomass data found

No TZ OakLeaves Biomass data found

No TZ PineNeedles Biomass data found

3 photos found
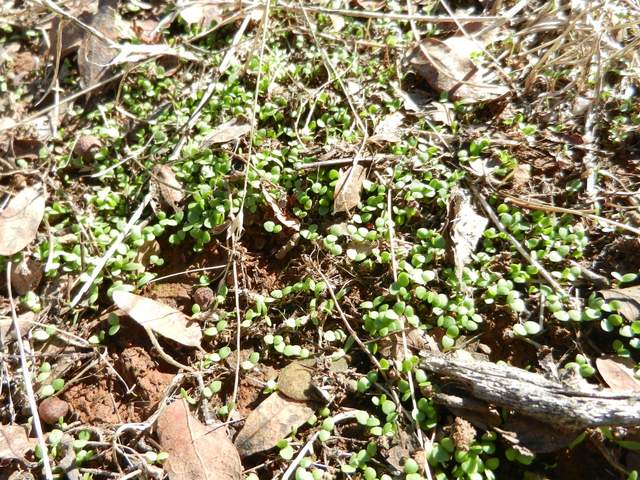
Green herb sprouts starting to come up through the brown litter. There was about 90mm of rain last Friday through Sunday, but the ground surface looks dry and there was no puddles I could see.
20161020TZ_HerbSprouts.jpg ( 2016-10-20 13:47:44 ) Full size: 1920x1440
Green herb sprouts starting to come up through the brown litter. There was about 90mm of rain last Friday through Sunday, but the ground surface looks dry and there was no puddles I could see.
1cm tall, green grass sprouts starting to come up through the brown litter. There was about 90mm of rain last Friday through Sunday, but the ground surface looks dry and there was no puddles I could see.
20161020TZ_GrassSprouts.jpg ( 2016-10-20 13:48:37 ) Full size: 1920x1440
1cm tall, green grass sprouts starting to come up through the brown litter. There was about 90mm of rain last Friday through Sunday, but the ground surface looks dry and there was no puddles I could see.

A bunch of spiderwebs near/on the eddy equipment
20161020TZ_SpiderWebs.jpg ( 2016-10-20 13:25:49 ) Full size: 1920x1440
A bunch of spiderwebs near/on the eddy equipment

Graphs display:
16 sets found

No data found for TZ_Fenergy.
11 TZ_tmet graphs found

Explore the graph:Tonzi Tower Met: Temperature and Power in a new window

Explore the graph:Tonzi Tower Met: Solar Radiation in a new window

Explore the graph:Tonzi Tower Met: IRT Sensors in a new window

Explore the graph:LED Sensor Incoming in a new window

Explore the graph:LED Sensor Outgoing in a new window

Explore the graph:4-Band Solar Radiation in a new window

Explore the graph:Air Temperature Profile in a new window

Explore the graph:Relativity Humidity Profile in a new window

Explore the graph:Tonzi Tower PRI in a new window

Explore the graph:SRS PRI/NDVI in a new window

Explore the graph:SRS NDVI in a new window

11 TZ_soilco2 graphs found

Explore the graph:Tonzi Soil CO2 Profile: Open (East) CO2 in a new window

Explore the graph:Tonzi Soil CO2 Profile: Tree (West) CO2 in a new window

Explore the graph:Tonzi Soil CO2 Profile: Open (East) Temperatures in a new window

Explore the graph:Tonzi Soil CO2 Profile: Tree (West) Temperatures in a new window

Explore the graph:Tonzi Soil CO2 Profile: Upper CO2 in a new window

Explore the graph:Tonzi Soil CO2 Profile: Lower CO2 in a new window

Explore the graph:Tonzi Soil CO2 Profile: Upper Temperatures in a new window

Explore the graph:Tonzi Soil CO2 Profile: Lower Temperatures in a new window

Explore the graph:Tonzi Soil CO2 Profile: Power and Temperature in a new window

Explore the graph:Tree 2 Soil CO2 in a new window

Explore the graph:Tree 2 Soil Temperature in a new window

Can't check TZ_mixed
3 TZ_mixed graphs found

Explore the graph:Tonzi PPT in a new window

Explore the graph:Tonzi CO2 and H2O Densities in a new window

Explore the graph:Air Pressure in a new window

1 TZ_fflux graphs found

Explore the graph:Tonzi Wind Speed in a new window

8 TZ_fmet graphs found

Explore the graph:Soil Heat Flux in a new window

Explore the graph:Tonzi Soil Temperature Set A in a new window

Explore the graph:Tonzi Soil Temperatures Set B in a new window

Explore the graph:Tonzi Soil Temperatures Set C in a new window

Explore the graph:Tonzi Soil Temperature Set D in a new window

Explore the graph:Well Level in a new window

Explore the graph:Well Water Temperature in a new window

Explore the graph:Soil Water Potential in a new window

No data found for TZ_tram.
3 TZ_co2prof graphs found

Explore the graph:Tower CO2 Profile Concentrations in a new window

Explore the graph:Tower CO2 Profile Cell Pressure in a new window

Explore the graph:CO2 Profile Sensor Temperature in a new window

1 TZ_irt graphs found

Explore the graph:Surface Temperatures in a new window

No data found for TZ_windprof.
1 TZ_tflux graphs found

Explore the graph:Tower CO2 and H2O in a new window

2 TZ_sm graphs found

Explore the graph:Floor Solar Radiations in a new window

Explore the graph:TZ Soil Moisture in a new window

Can't check TZ_met
1 TZ_met graphs found

Explore the graph:Floor and Tower RH in a new window

Can't check TZVR_mixed
No data found for TZ_osu.
No data found for TZ_fd.
Tonzi Z-cam data

plot of Tonzi z-cam LAI

plot of Tonzi z-cam gap fration