Field Notes

<--2016-09-29 09:30:00 | 2016-10-11 09:15:00-->
Other sites visited today: Bouldin Alfalfa | Twitchell Rice | Mayberry
Phenocam link: Searching...

Sherman Wetland: 2016-10-06 14:00:00 (DOY 280)
Author: Joe Verfaillie
Others:

Summary: Fixed NDVI, PRI sensors, lots of wasps.

Sherman Wetland
2016-10-06

I arrived about 2pm. It was clear, sunny and warm. They have completed the mowing that started last week. The east side of the levee has been mowed now making it much easier to drive along it to the beginning of the boardwalk. There are lots of wasps buzzing around the boardwalk. Maybe better to do this site early in the morning when it’s cold.

I fixed the PRI and NDVI sensors. Their SDI-12 wires had been pulled loose from the control port. It was a tight stretch to get them back in, so I added an extension wire to a four port screw terminal. This worked well.

Here too, I opened the wash box lid and threw in some moth balls. I left the lid open hoping the wasps will relocate.

1 photos found

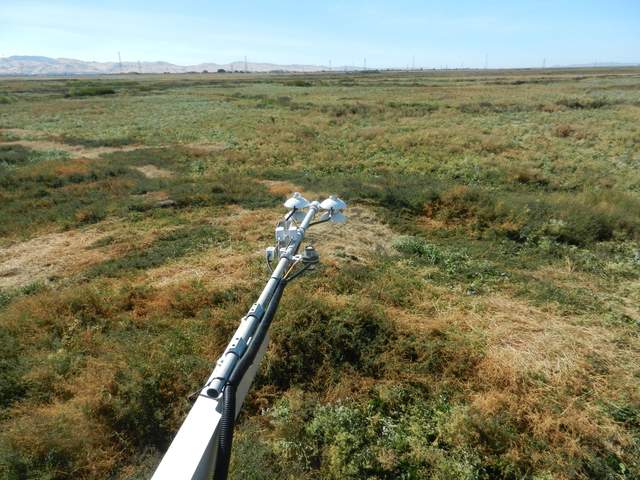
Radiometers over pasture. Flooding as part of the wetland restoration will start next month.
20161006SW_Radiometers.jpg ( 2016-10-06 14:40:53 ) Full size: 1920x1440
Radiometers over pasture. Flooding as part of the wetland restoration will start next month.

Graphs display:
7 sets found

Can't check MBWPEESWGT_mixed
Can't check MBEEWPSWEPGT_cam
15 SW_met graphs found

Explore the graph:Temperatures in a new window

Explore the graph:Water Temperature Profile A in a new window

Explore the graph:Water Temperature Profile B in a new window

Explore the graph:Soil Temperature Profile C2 in a new window

Explore the graph:Soil Heat Flux in a new window

Explore the graph:Four channel Radiometer in a new window

Explore the graph:Sherman Wetland PAR in a new window

Explore the graph:PRI Channels in a new window

Explore the graph:NDVI Channels in a new window

Explore the graph:Water level and Rain in a new window

Explore the graph:Dissolved CO2 in a new window

Explore the graph:Air Pressure in a new window

Explore the graph:Battery Voltage and RH in a new window

Explore the graph:Soil Temperature Profile C1 in a new window

Explore the graph:SRS NDVI and PRI in a new window

4 SW_flux graphs found

Explore the graph:CO2 and H2O in a new window

Explore the graph:Wind in a new window

Explore the graph:Methane in a new window

Explore the graph:Data Counts in a new window

Can't check MBSWEEWPBCBA
Can't check SW_Temp
14 SW_Temp graphs found

Explore the graph:Temperatures in a new window

Explore the graph:CO2 and H2O in a new window

Explore the graph:Wind in a new window

Explore the graph:Methane in a new window

Explore the graph:Data Counts in a new window

Explore the graph:Temperature Profile A in a new window

Explore the graph:Temperature Profile B in a new window

Explore the graph:Temperature Profile C in a new window

Explore the graph:Soil Heat Flux in a new window

Explore the graph:Four-channel radiometer in a new window

Explore the graph:NDVI Channels in a new window

Explore the graph:PAR in a new window

Explore the graph:Air Pressure and Water Level in a new window

Explore the graph:Air T and RH in a new window

No data found for SW_arable.