
Field Notes
<--2016-08-31 13:10:00 | 2016-09-22 16:15:00-->Other sites visited today: Bouldin Alfalfa | Tonzi | Vaira | Tonzi | Twitchell Rice | Mayberry | West Pond | East End
Phenocam link: Searching...
Twitchell Alfalfa: 2016-09-13 09:50:00 (DOY 257)
Author: Elke Eichelmann
Others: Kyle Hemes, Dennis Baldocchi, Isabella Reche
Summary: Low power so some data missing, alfalfa getting tall, normal data collection
| Arrived 9:50. Clear, sunny, slight breeze, hazy. Alfalfa is getting tall, starting to bloom, will probably be cut soon, really chewed down by caterpillars in some places. Lots of butterflies in the field. Lots of bird poop around the tower and on solar panels. Collected USB GHG data; collected met data from CR1000; collected rad data from CR10X, box was not running only got data from DOY 244 to 246 probably due to low power; collected camera card: swapped CF card “TA†in and “TA†out; collected soil CO2, STC(14)=NAN. Had some trouble turning off the camera, had to hold down the button for awhile, only have pictures up to September 8, 6:45. Battery volt 11.9, solar panels really dirty, maybe we lost power overnight? Dennis did spectral measurements, Kyle did soil respiration: collar 6 was unable to pump down to limit. Filled in holes from ground squirrels. LI7500 readings CO2 374.41 H2O 578.8 T 16.91 P 101.11 ss 83.78 -> 86.65 after cleaning left: 10:45 |
Veg Height (cm): Tape measure from ground to top of plant - Flowering, lots of butterflies, soon to be cut
32, 32, 24, 29, 30, 40, 44, 39, 39, 34, 43, 38, 35, 49, 38, 20, 39, 10, 42, 38, 40, 42, 42, avg = 35.6, stdev = 8.67
2 photos found
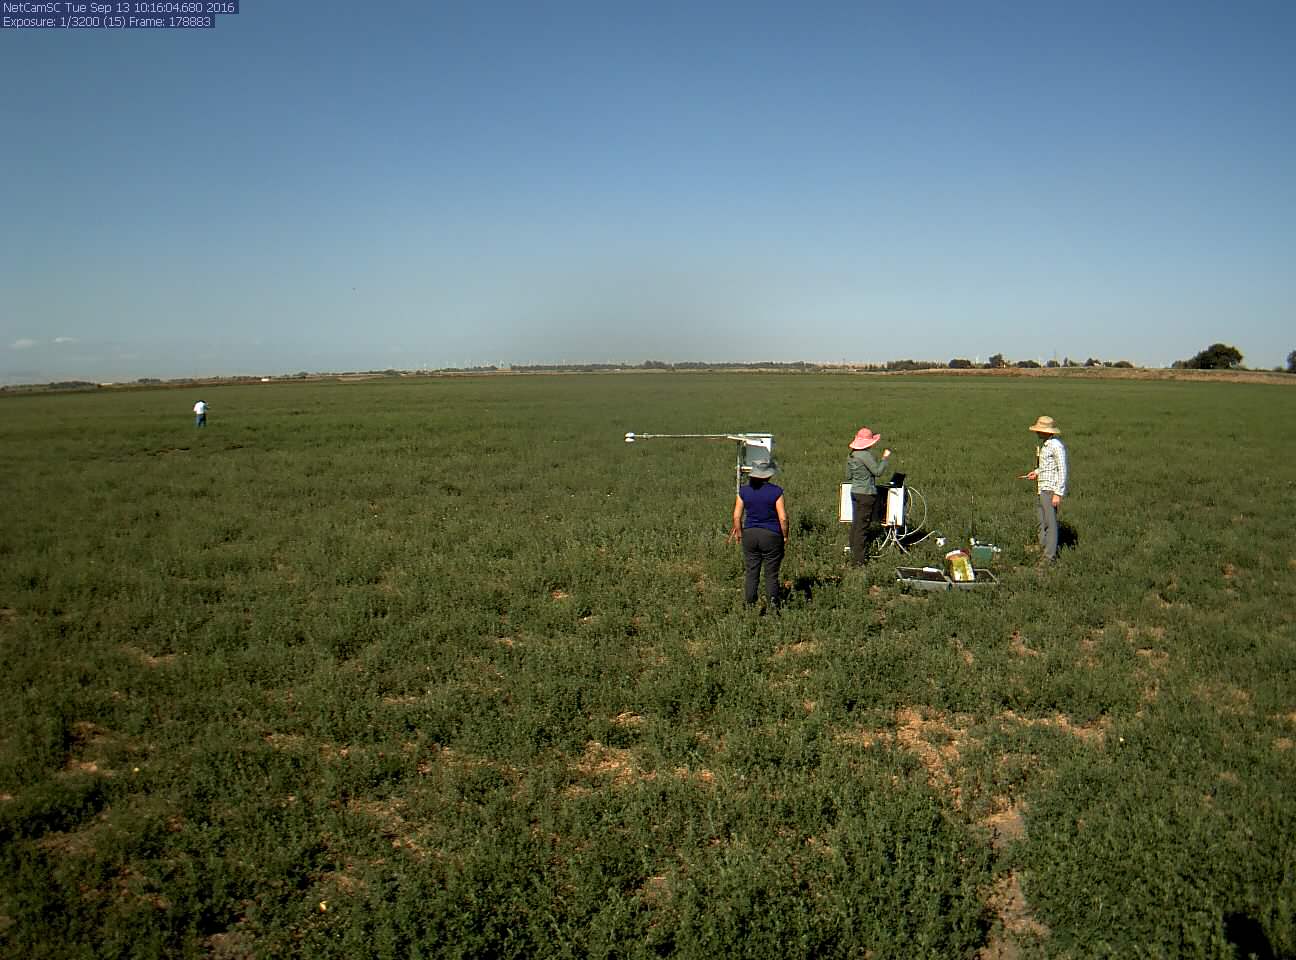
twitchellalfalfa_2016_09_13_101604.jpg ( 2016-09-13 08:22:00 ) Full size: 1296x960
Isabel, Elke, Kyle
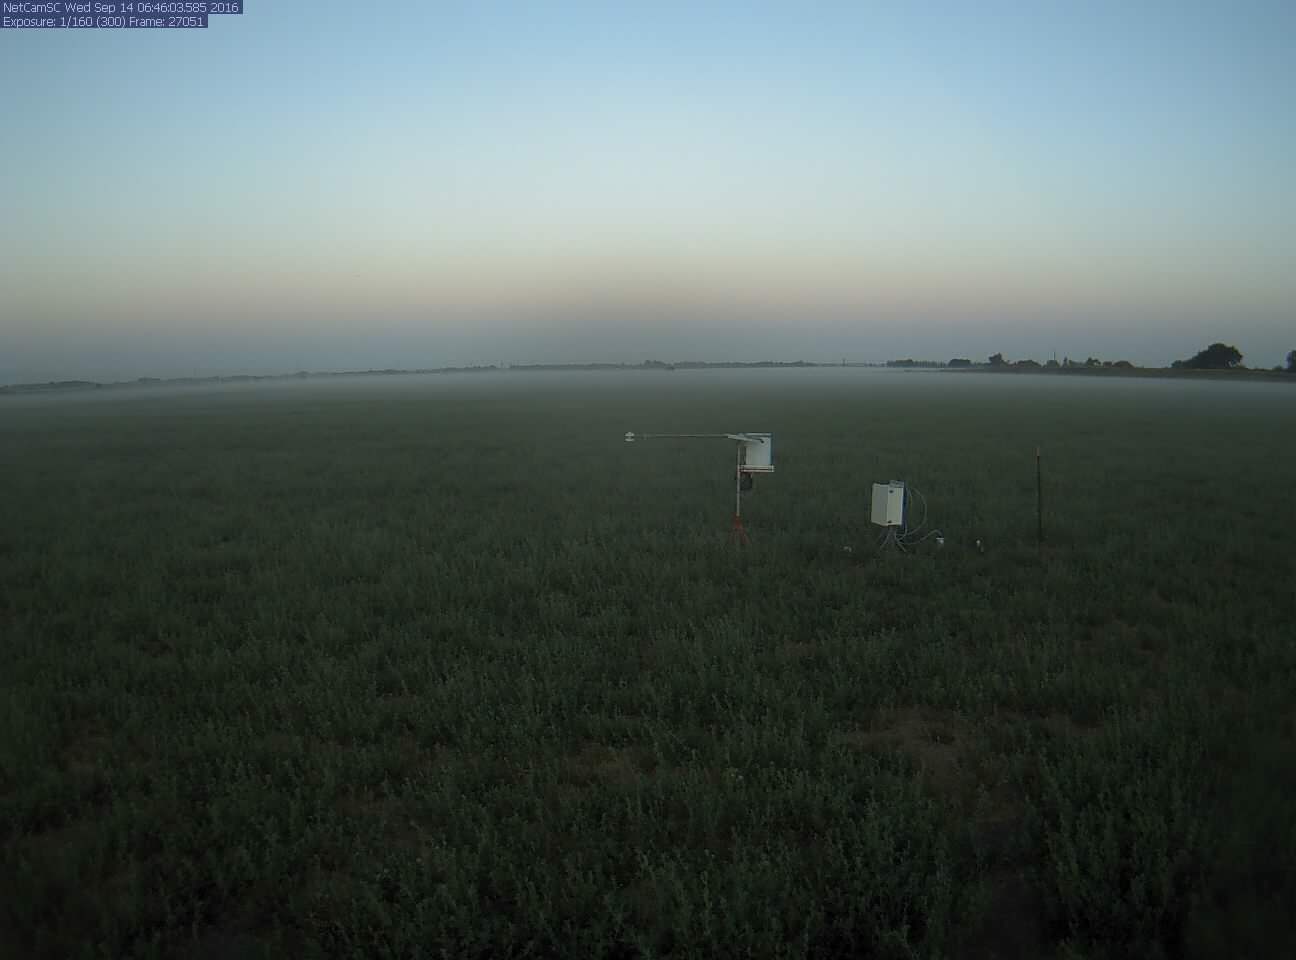
twitchellalfalfa_2016_09_14_064603.jpg ( 2016-09-14 04:51:58 ) Full size: 1296x960
Tule fog
7 sets found
Can't check TA_met
11 TA_met graphs found
Can't check TA_rad
3 TA_rad graphs found
Can't check TA_flux
5 TA_flux graphs found
Can't check TA_soilco2
7 TA_soilco2 graphs found
No data found for TA_arable.
1 TA_cam graphs found
Can't check TATWBABCSB_cam