
Field Notes
<--2016-04-05 10:30:00 | 2016-06-16 10:00:00-->Other sites visited today: Tonzi | Tonzi
Phenocam link: Searching...
Vaira: 2016-05-26 10:00:00 (DOY 147)
Author: Joe Verfaillie
Others: Siyan
Summary: Standard field work, grasses mostly dead.
| Vaira 2016-05-26 I arrived about 10:00 with Siyan. It was warm, sunny and clear with a breeze from the west. The grass is mostly dead, but there seems to be a peppering of green grasses mixed in with the dead like a second batch came up later. The puddles in the road were dry but the water hole was still full. I collected the data from the tower and cleaned the radiation sensors. I knocked down the grass in front of the solar panels. Siyan did soil moisture, clip plots and spectral measurements. |
Veg Height (cm): Tape measure from ground to top of plant - Outside fenced area - grazed
110, 115, 80, 95, 95, 55, 65, 40, 45, 55, 85, 40, 70, 53, 55, avg = 70.5, stdev = 24.8
Field Data
No tank data
Well Depth
| Date | Location | Depth (feet) |
|---|---|---|
| 2016-05-26 | TZ_floor | 22.9 |
| 2016-05-26 | TZ_road | 31.5 |
| 2016-05-26 | TZ_tower | 26.6 |
mode = both
Moisture Point Probes TZ
Array
(
[0] => Tower_1
[1] => Floor_South_1
[2] => Floor_East_1
[3] => Floor_West_1
[4] => SoilCO2_1
[5] => Soil_Transect_4_1
[6] => Soil_Transect_3_1
[7] => Soil_Transect_2_1
[8] => Soil_Transect_1_1
[9] => SoilCO2_West_A_1
[10] => SoilCO2_West_B_1
[11] => SoilCO2_West_C_1
[12] => Tower_2
[13] => Floor_South_2
[14] => Floor_East_2
[15] => Floor_West_2
[16] => SoilCO2_2
[17] => Soil_Transect_4_2
[18] => Soil_Transect_3_2
[19] => Soil_Transect_2_2
[20] => Soil_Transect_1_2
[21] => SoilCO2_West_A_2
[22] => SoilCO2_West_B_2
[23] => SoilCO2_West_C_2
[24] => Tower_3
[25] => Floor_South_3
[26] => Floor_East_3
[27] => Floor_West_3
[28] => SoilCO2_3
[29] => Soil_Transect_4_3
[30] => Soil_Transect_3_3
[31] => Soil_Transect_2_3
[32] => Soil_Transect_1_3
[33] => SoilCO2_West_A_3
[34] => SoilCO2_West_B_3
[35] => SoilCO2_West_C_3
[36] => Tower_4
[37] => Floor_South_4
[38] => Floor_East_4
[39] => Floor_West_4
[40] => SoilCO2_4
[41] => Soil_Transect_4_4
[42] => Soil_Transect_3_4
[43] => Soil_Transect_2_4
[44] => Soil_Transect_1_4
[45] => SoilCO2_West_A_4
[46] => SoilCO2_West_B_4
[47] => SoilCO2_West_C_4
)
| Date | DOY | Rep | Depth | Tower_1 |
Floor_South_1 |
Floor_East_1 |
Floor_West_1 |
SoilCO2_1 |
Soil_Transect_4_1 |
Soil_Transect_3_1 |
Soil_Transect_2_1 |
Soil_Transect_1_1 |
SoilCO2_West_A_1 |
SoilCO2_West_B_1 |
SoilCO2_West_C_1 |
Tower_2 |
Floor_South_2 |
Floor_East_2 |
Floor_West_2 |
SoilCO2_2 |
Soil_Transect_4_2 |
Soil_Transect_3_2 |
Soil_Transect_2_2 |
Soil_Transect_1_2 |
SoilCO2_West_A_2 |
SoilCO2_West_B_2 |
SoilCO2_West_C_2 |
Tower_3 |
Floor_South_3 |
Floor_East_3 |
Floor_West_3 |
SoilCO2_3 |
Soil_Transect_4_3 |
Soil_Transect_3_3 |
Soil_Transect_2_3 |
Soil_Transect_1_3 |
SoilCO2_West_A_3 |
SoilCO2_West_B_3 |
SoilCO2_West_C_3 |
Tower_4 |
Floor_South_4 |
Floor_East_4 |
Floor_West_4 |
SoilCO2_4 |
Soil_Transect_4_4 |
Soil_Transect_3_4 |
Soil_Transect_2_4 |
Soil_Transect_1_4 |
SoilCO2_West_A_4 |
SoilCO2_West_B_4 |
SoilCO2_West_C_4 |
Avg | Spacial Count |
Measurement Count |
|---|---|---|---|---|---|---|---|---|---|---|---|---|---|---|---|---|---|---|---|---|---|---|---|---|---|---|---|---|---|---|---|---|---|---|---|---|---|---|---|---|---|---|---|---|---|---|---|---|---|---|---|---|---|---|
| 2016-05-26 | 147 | 0 | nan | 7.7 | 5.9 | 13.9 | 11.1 | 13.5 | 11.1 | 5 | 8.8 | 8.6 | 13.5 | 9.1 | 8.8 | 22.1 | 16.7 | 13.3 | 7.2 | 13.3 | 10.3 | 17.3 | 16.4 | 6.3 | 13 | 2.9 | 16.4 | 17.8 | 14.8 | 18.2 | 16.8 | 17 | 11.7 | 18.4 | 22.1 | 17.9 | 21.5 | 19.9 | 13.1 | 14.8 | 12.8 | 31.4 | 23.1 | 11.1 | 14.2 | 25.1 | 31.4 | 15 | 29.9 | 25.1 | 41.4 | |||
| 2016-05-26 | 147 | 1 | nan | 7.7 | 6.5 | 13.8 | 14.9 | 13.8 | 3.9 | 5.6 | 8.6 | 9.7 | 14.4 | 8.8 | 8.3 | 12.1 | 16.7 | 14.8 | 6.9 | 13.3 | 10.6 | 16.4 | 16.4 | 6.3 | 12.1 | 2.6 | 17.3 | 19.3 | 14 | 20.4 | 16.9 | 17.6 | 11.5 | 18.4 | 21.8 | 17.9 | 21.5 | 20.4 | 14.8 | 14.9 | 12.8 | 34.2 | 23.9 | 28.5 | 14.5 | 25.1 | 31.9 | 15 | 29.4 | 24.8 | 36.2 | |||
| 2016-05-26 | 147 | Avg | 0-15cm | 0 | 0 | |||||||||||||||||||||||||||||||||||||||||||||||||
| 2016-05-26 | 147 | Avg | 15-30cm | 0 | 0 | |||||||||||||||||||||||||||||||||||||||||||||||||
| 2016-05-26 | 147 | Avg | 30-45cm | 0 | 0 | |||||||||||||||||||||||||||||||||||||||||||||||||
| 2016-05-26 | 147 | Avg | 45-60cm | 0 | 0 |
mode = both
Moisture Point Probes VR
Array
(
[0] => Solar_Panels_1
[1] => Flux_Tower_1
[2] => Gate_1
[3] => Biomass_Cage_1
[4] => Solar_Panels_2
[5] => Flux_Tower_2
[6] => Gate_2
[7] => Biomass_Cage_2
[8] => Solar_Panels_3
[9] => Flux_Tower_3
[10] => Gate_3
[11] => Biomass_Cage_3
[12] => Solar_Panels_4
[13] => Flux_Tower_4
[14] => Gate_4
[15] => Biomass_Cage_4
)
| Date | DOY | Rep | Depth | Solar_Panels_1 |
Flux_Tower_1 |
Gate_1 |
Biomass_Cage_1 |
Solar_Panels_2 |
Flux_Tower_2 |
Gate_2 |
Biomass_Cage_2 |
Solar_Panels_3 |
Flux_Tower_3 |
Gate_3 |
Biomass_Cage_3 |
Solar_Panels_4 |
Flux_Tower_4 |
Gate_4 |
Biomass_Cage_4 |
Avg | Spacial Count |
Measurement Count |
|---|---|---|---|---|---|---|---|---|---|---|---|---|---|---|---|---|---|---|---|---|---|---|
| 2016-05-26 | 147 | 0 | nan | 5.3 | 4.9 | 5.6 | 1.2 | 11.5 | 8.4 | 6.9 | 5.7 | 15.6 | 5.3 | 11.2 | 12 | 27.1 | 14.8 | 12.5 | 15 | |||
| 2016-05-26 | 147 | 1 | nan | 5.3 | 4.9 | 5.9 | 0.9 | 12.1 | 7.8 | 7.2 | 5.7 | 15.4 | 4.9 | 11.7 | 12.6 | 27.4 | 15 | 11 | 15.3 | |||
| 2016-05-26 | 147 | Avg | 0-15cm | 0 | 0 | |||||||||||||||||
| 2016-05-26 | 147 | Avg | 15-30cm | 0 | 0 | |||||||||||||||||
| 2016-05-26 | 147 | Avg | 30-45cm | 0 | 0 | |||||||||||||||||
| 2016-05-26 | 147 | Avg | 45-60cm | 0 | 0 |
Grass Height TZ 15
| Date | Height reps (cm) | Location | Average | Samp | STDEV | ||||||||||||||
|---|---|---|---|---|---|---|---|---|---|---|---|---|---|---|---|---|---|---|---|
| 2016-05-26 | 32 | 28 | 23 | 28 | 30 | 85 | 70 | 75 | 80 | 70 | 20 | 32 | 42 | 30 | 35 | GH_ALL | 45.33 | 15 | 22.45 |
Grass Height VR 15
| Date | Height reps (cm) | Location | Average | Samp | STDEV | ||||||||||||||
|---|---|---|---|---|---|---|---|---|---|---|---|---|---|---|---|---|---|---|---|
| 2016-05-26 | 110 | 115 | 80 | 95 | 95 | 55 | 65 | 40 | 45 | 55 | 85 | 40 | 70 | 53 | 55 | GH_ALL | 70.53 | 15 | 23.96 |
No VR Tree DBH found
No water potential data found
No VR Grass Biomass data found
No VR OakLeaves Biomass data found
No VR PineNeedles Biomass data found
1 photos found
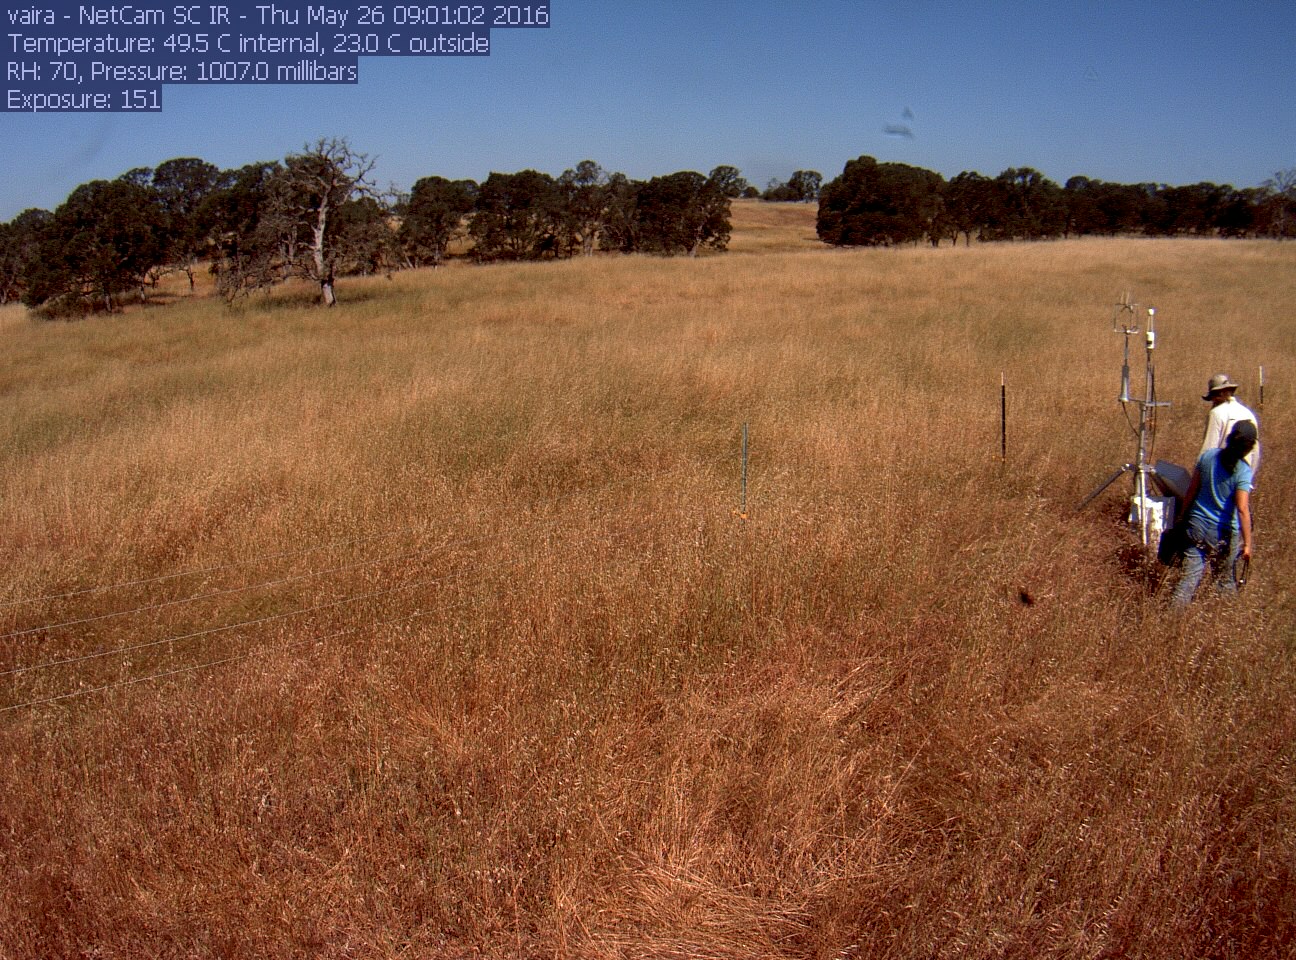
vaira_2016_05_26_090102.jpg ( 2016-05-26 00:00:00 ) Full size: 1296x960
Joe and Siyan on site
9 sets found
16 VR_met graphs found
2 VR_flux graphs found
6 VR_soilco2 graphs found
No data found for VR_pond.
Can't check TZVR_mixed
No data found for VR_fd.
No data found for VR_processed.
No data found for VR_arable.
No data found for VR_soilvue.