
Field Notes
<--2016-05-26 11:00:00 | 2016-05-31 10:30:00-->Other sites visited today: Vaira | Tonzi
Phenocam link: Searching...
Tonzi: 2016-05-26 11:00:00 (DOY 147)
Author: Siyan Ma
Others: Joe
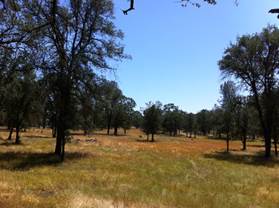
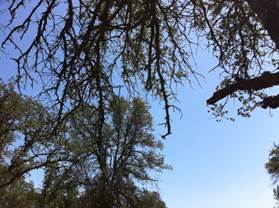
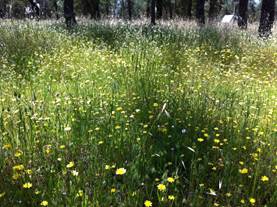
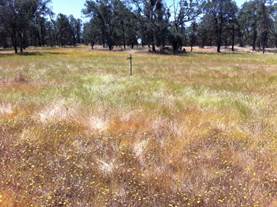
Summary: Standard fieldwork, grass growing season over, continuing tree survey.
|
When: Date: 5/26//2016 , Watch Time: 11:00 am . Where: Tonzi/Vaira Ranch Who: Siyan, Joe Weather: clear, sunny Phenology: annual grasses’ growing season is over
Summary
Stop by new Sherman site
|
Veg Height (cm): Tape measure from ground to top of plant
32, 28, 23, 28, 30, 85, 70, 75, 80, 70, 20, 32, 42, 30, 35, avg = 45.3, stdev = 23.23
Field Data
No tank data
Well Depth
| Date | Location | Depth (feet) |
|---|---|---|
| 2016-05-26 | TZ_floor | 22.9 |
| 2016-05-26 | TZ_road | 31.5 |
| 2016-05-26 | TZ_tower | 26.6 |
mode = both
Moisture Point Probes TZ
Array
(
[0] => Tower_1
[1] => Floor_South_1
[2] => Floor_East_1
[3] => Floor_West_1
[4] => SoilCO2_1
[5] => Soil_Transect_4_1
[6] => Soil_Transect_3_1
[7] => Soil_Transect_2_1
[8] => Soil_Transect_1_1
[9] => SoilCO2_West_A_1
[10] => SoilCO2_West_B_1
[11] => SoilCO2_West_C_1
[12] => Tower_2
[13] => Floor_South_2
[14] => Floor_East_2
[15] => Floor_West_2
[16] => SoilCO2_2
[17] => Soil_Transect_4_2
[18] => Soil_Transect_3_2
[19] => Soil_Transect_2_2
[20] => Soil_Transect_1_2
[21] => SoilCO2_West_A_2
[22] => SoilCO2_West_B_2
[23] => SoilCO2_West_C_2
[24] => Tower_3
[25] => Floor_South_3
[26] => Floor_East_3
[27] => Floor_West_3
[28] => SoilCO2_3
[29] => Soil_Transect_4_3
[30] => Soil_Transect_3_3
[31] => Soil_Transect_2_3
[32] => Soil_Transect_1_3
[33] => SoilCO2_West_A_3
[34] => SoilCO2_West_B_3
[35] => SoilCO2_West_C_3
[36] => Tower_4
[37] => Floor_South_4
[38] => Floor_East_4
[39] => Floor_West_4
[40] => SoilCO2_4
[41] => Soil_Transect_4_4
[42] => Soil_Transect_3_4
[43] => Soil_Transect_2_4
[44] => Soil_Transect_1_4
[45] => SoilCO2_West_A_4
[46] => SoilCO2_West_B_4
[47] => SoilCO2_West_C_4
)
| Date | DOY | Rep | Depth | Tower_1 |
Floor_South_1 |
Floor_East_1 |
Floor_West_1 |
SoilCO2_1 |
Soil_Transect_4_1 |
Soil_Transect_3_1 |
Soil_Transect_2_1 |
Soil_Transect_1_1 |
SoilCO2_West_A_1 |
SoilCO2_West_B_1 |
SoilCO2_West_C_1 |
Tower_2 |
Floor_South_2 |
Floor_East_2 |
Floor_West_2 |
SoilCO2_2 |
Soil_Transect_4_2 |
Soil_Transect_3_2 |
Soil_Transect_2_2 |
Soil_Transect_1_2 |
SoilCO2_West_A_2 |
SoilCO2_West_B_2 |
SoilCO2_West_C_2 |
Tower_3 |
Floor_South_3 |
Floor_East_3 |
Floor_West_3 |
SoilCO2_3 |
Soil_Transect_4_3 |
Soil_Transect_3_3 |
Soil_Transect_2_3 |
Soil_Transect_1_3 |
SoilCO2_West_A_3 |
SoilCO2_West_B_3 |
SoilCO2_West_C_3 |
Tower_4 |
Floor_South_4 |
Floor_East_4 |
Floor_West_4 |
SoilCO2_4 |
Soil_Transect_4_4 |
Soil_Transect_3_4 |
Soil_Transect_2_4 |
Soil_Transect_1_4 |
SoilCO2_West_A_4 |
SoilCO2_West_B_4 |
SoilCO2_West_C_4 |
Avg | Spacial Count |
Measurement Count |
|---|---|---|---|---|---|---|---|---|---|---|---|---|---|---|---|---|---|---|---|---|---|---|---|---|---|---|---|---|---|---|---|---|---|---|---|---|---|---|---|---|---|---|---|---|---|---|---|---|---|---|---|---|---|---|
| 2016-05-26 | 147 | 0 | nan | 7.7 | 5.9 | 13.9 | 11.1 | 13.5 | 11.1 | 5 | 8.8 | 8.6 | 13.5 | 9.1 | 8.8 | 22.1 | 16.7 | 13.3 | 7.2 | 13.3 | 10.3 | 17.3 | 16.4 | 6.3 | 13 | 2.9 | 16.4 | 17.8 | 14.8 | 18.2 | 16.8 | 17 | 11.7 | 18.4 | 22.1 | 17.9 | 21.5 | 19.9 | 13.1 | 14.8 | 12.8 | 31.4 | 23.1 | 11.1 | 14.2 | 25.1 | 31.4 | 15 | 29.9 | 25.1 | 41.4 | |||
| 2016-05-26 | 147 | 1 | nan | 7.7 | 6.5 | 13.8 | 14.9 | 13.8 | 3.9 | 5.6 | 8.6 | 9.7 | 14.4 | 8.8 | 8.3 | 12.1 | 16.7 | 14.8 | 6.9 | 13.3 | 10.6 | 16.4 | 16.4 | 6.3 | 12.1 | 2.6 | 17.3 | 19.3 | 14 | 20.4 | 16.9 | 17.6 | 11.5 | 18.4 | 21.8 | 17.9 | 21.5 | 20.4 | 14.8 | 14.9 | 12.8 | 34.2 | 23.9 | 28.5 | 14.5 | 25.1 | 31.9 | 15 | 29.4 | 24.8 | 36.2 | |||
| 2016-05-26 | 147 | Avg | 0-15cm | 0 | 0 | |||||||||||||||||||||||||||||||||||||||||||||||||
| 2016-05-26 | 147 | Avg | 15-30cm | 0 | 0 | |||||||||||||||||||||||||||||||||||||||||||||||||
| 2016-05-26 | 147 | Avg | 30-45cm | 0 | 0 | |||||||||||||||||||||||||||||||||||||||||||||||||
| 2016-05-26 | 147 | Avg | 45-60cm | 0 | 0 |
mode = both
Moisture Point Probes VR
Array
(
[0] => Solar_Panels_1
[1] => Flux_Tower_1
[2] => Gate_1
[3] => Biomass_Cage_1
[4] => Solar_Panels_2
[5] => Flux_Tower_2
[6] => Gate_2
[7] => Biomass_Cage_2
[8] => Solar_Panels_3
[9] => Flux_Tower_3
[10] => Gate_3
[11] => Biomass_Cage_3
[12] => Solar_Panels_4
[13] => Flux_Tower_4
[14] => Gate_4
[15] => Biomass_Cage_4
)
| Date | DOY | Rep | Depth | Solar_Panels_1 |
Flux_Tower_1 |
Gate_1 |
Biomass_Cage_1 |
Solar_Panels_2 |
Flux_Tower_2 |
Gate_2 |
Biomass_Cage_2 |
Solar_Panels_3 |
Flux_Tower_3 |
Gate_3 |
Biomass_Cage_3 |
Solar_Panels_4 |
Flux_Tower_4 |
Gate_4 |
Biomass_Cage_4 |
Avg | Spacial Count |
Measurement Count |
|---|---|---|---|---|---|---|---|---|---|---|---|---|---|---|---|---|---|---|---|---|---|---|
| 2016-05-26 | 147 | 0 | nan | 5.3 | 4.9 | 5.6 | 1.2 | 11.5 | 8.4 | 6.9 | 5.7 | 15.6 | 5.3 | 11.2 | 12 | 27.1 | 14.8 | 12.5 | 15 | |||
| 2016-05-26 | 147 | 1 | nan | 5.3 | 4.9 | 5.9 | 0.9 | 12.1 | 7.8 | 7.2 | 5.7 | 15.4 | 4.9 | 11.7 | 12.6 | 27.4 | 15 | 11 | 15.3 | |||
| 2016-05-26 | 147 | Avg | 0-15cm | 0 | 0 | |||||||||||||||||
| 2016-05-26 | 147 | Avg | 15-30cm | 0 | 0 | |||||||||||||||||
| 2016-05-26 | 147 | Avg | 30-45cm | 0 | 0 | |||||||||||||||||
| 2016-05-26 | 147 | Avg | 45-60cm | 0 | 0 |
Grass Height TZ 15
| Date | Height reps (cm) | Location | Average | Samp | STDEV | ||||||||||||||
|---|---|---|---|---|---|---|---|---|---|---|---|---|---|---|---|---|---|---|---|
| 2016-05-26 | 32 | 28 | 23 | 28 | 30 | 85 | 70 | 75 | 80 | 70 | 20 | 32 | 42 | 30 | 35 | GH_ALL | 45.33 | 15 | 22.45 |
Grass Height VR 15
| Date | Height reps (cm) | Location | Average | Samp | STDEV | ||||||||||||||
|---|---|---|---|---|---|---|---|---|---|---|---|---|---|---|---|---|---|---|---|
| 2016-05-26 | 110 | 115 | 80 | 95 | 95 | 55 | 65 | 40 | 45 | 55 | 85 | 40 | 70 | 53 | 55 | GH_ALL | 70.53 | 15 | 23.96 |
Tree DBH
| Date | Tag# | Reading (mm) |
|---|---|---|
| 2016-05-26 | 1 | 23.6 |
| 2016-05-26 | 2 | 18.1 |
| 2016-05-26 | 3 | 21.6 |
| 2016-05-26 | 4 | 16.7 |
| 2016-05-26 | 5 | 18.2 |
| 2016-05-26 | 7 | 15.6 |
| 2016-05-26 | 72 | 23.2 |
| 2016-05-26 | 79 | 23.5 |
| 2016-05-26 | 8 | 19.0 |
Water Potential - mode: raw
| Time | Species | Tree | readings (bar) | ||
|---|---|---|---|---|---|
| 2016-05-26 01:10:00 | PINE | OLD | -20 | -5 | -22 |
| 2016-05-26 01:10:00 | PINE | YNG | -5 | -4 | -5 |
| 2016-05-26 12:50:00 | OAK | 102 | -11 | -12 | -12.5 |
| 2016-05-26 12:50:00 | OAK | 35 | -17 | -22 | -16 |
| 2016-05-26 12:50:00 | OAK | 92 | -24 | -28 | -30 |
No TZ Grass Biomass data found
No TZ OakLeaves Biomass data found
No TZ PineNeedles Biomass data found
0 photos found
16 sets found
No data found for TZ_Fenergy.
11 TZ_tmet graphs found
11 TZ_soilco2 graphs found
Can't check TZ_mixed
3 TZ_mixed graphs found
1 TZ_fflux graphs found
8 TZ_fmet graphs found
No data found for TZ_tram.
No data found for TZ_co2prof.
1 TZ_irt graphs found
No data found for TZ_windprof.
1 TZ_tflux graphs found
2 TZ_sm graphs found
Can't check TZ_met
1 TZ_met graphs found
Can't check TZVR_mixed
No data found for TZ_osu.
No data found for TZ_fd.
Tonzi Z-cam data