
Field Notes
<--2016-03-23 09:00:00 | 2016-04-05 10:00:00-->Other sites visited today: Tonzi | Vaira
Phenocam link: Searching...
Tonzi: 2016-03-23 10:00:00 (DOY 83)
Author: Joe Verfaillie
Others: Siyan
Summary: Swapped tower computer and added modem, removed tower rope, removed soil CO2 relay at Open profile.
| Tonzi 2016-03-23 I arrived about 10am with Siyan. It was warm, clear and sunny. Everything is very green. The tree leaves are still young and light green. Some flowers already on the ground. Tonzi’s pond is full. I swapped out the Compute Stick at the Tower for a new one with Windows 10 and an AT&T modem. It is setup to collect the 30min averages from the CR1000 and to send that data to Berkeley each day at noontime. I got the scripts to run manually while I was there. But have not received data automatically. Something must be wrong. I’ll do some testing in the lab and try again before the Ameriflux inter-comparison. I removed the rope from the tower due to many chew marks. In fact a section broke off and got stuck in the pulley. I left the broken section there. The relay to power the Vaisala CO2 sensors in the Open profile broke. I removed the relay and powered the sensors directly. They will be on continuously until I replace the relay. The lens cover on zcam one is still getting stuck. The tower top met did not get fully collected. For the Ameriflux visit I can move the shadow band diffuse PAR sensor to a horizontal pipe, but I need to rotate the mount 90 degrees. |
Veg Height (cm): Tape measure from ground to top of plant
8, 26, 7, 16, 8, 13, 13, 18, 7, 10, 8, 20, 8, 7, 8, 13, 7, 8, avg = 11.4, stdev = 5.47
Field Data
No tank data
Well Depth
| Date | Location | Depth (feet) |
|---|---|---|
| 2016-03-23 | TZ_floor | 27.9 |
| 2016-03-23 | TZ_road | 32.3 |
| 2016-03-23 | TZ_tower | 27.9 |
mode = both
Moisture Point Probes TZ
Array
(
[0] => Tower_1
[1] => Floor_South_1
[2] => Floor_East_1
[3] => Floor_West_1
[4] => SoilCO2_1
[5] => Soil_Transect_4_1
[6] => Soil_Transect_3_1
[7] => Soil_Transect_2_1
[8] => Soil_Transect_1_1
[9] => SoilCO2_West_A_1
[10] => SoilCO2_West_B_1
[11] => SoilCO2_West_C_1
[12] => Tower_2
[13] => Floor_South_2
[14] => Floor_East_2
[15] => Floor_West_2
[16] => SoilCO2_2
[17] => Soil_Transect_4_2
[18] => Soil_Transect_3_2
[19] => Soil_Transect_2_2
[20] => Soil_Transect_1_2
[21] => SoilCO2_West_A_2
[22] => SoilCO2_West_B_2
[23] => SoilCO2_West_C_2
[24] => Tower_3
[25] => Floor_South_3
[26] => Floor_East_3
[27] => Floor_West_3
[28] => SoilCO2_3
[29] => Soil_Transect_4_3
[30] => Soil_Transect_3_3
[31] => Soil_Transect_2_3
[32] => Soil_Transect_1_3
[33] => SoilCO2_West_A_3
[34] => SoilCO2_West_B_3
[35] => SoilCO2_West_C_3
[36] => Tower_4
[37] => Floor_South_4
[38] => Floor_East_4
[39] => Floor_West_4
[40] => SoilCO2_4
[41] => Soil_Transect_4_4
[42] => Soil_Transect_3_4
[43] => Soil_Transect_2_4
[44] => Soil_Transect_1_4
[45] => SoilCO2_West_A_4
[46] => SoilCO2_West_B_4
[47] => SoilCO2_West_C_4
)
| Date | DOY | Rep | Depth | Tower_1 |
Floor_South_1 |
Floor_East_1 |
Floor_West_1 |
SoilCO2_1 |
Soil_Transect_4_1 |
Soil_Transect_3_1 |
Soil_Transect_2_1 |
Soil_Transect_1_1 |
SoilCO2_West_A_1 |
SoilCO2_West_B_1 |
SoilCO2_West_C_1 |
Tower_2 |
Floor_South_2 |
Floor_East_2 |
Floor_West_2 |
SoilCO2_2 |
Soil_Transect_4_2 |
Soil_Transect_3_2 |
Soil_Transect_2_2 |
Soil_Transect_1_2 |
SoilCO2_West_A_2 |
SoilCO2_West_B_2 |
SoilCO2_West_C_2 |
Tower_3 |
Floor_South_3 |
Floor_East_3 |
Floor_West_3 |
SoilCO2_3 |
Soil_Transect_4_3 |
Soil_Transect_3_3 |
Soil_Transect_2_3 |
Soil_Transect_1_3 |
SoilCO2_West_A_3 |
SoilCO2_West_B_3 |
SoilCO2_West_C_3 |
Tower_4 |
Floor_South_4 |
Floor_East_4 |
Floor_West_4 |
SoilCO2_4 |
Soil_Transect_4_4 |
Soil_Transect_3_4 |
Soil_Transect_2_4 |
Soil_Transect_1_4 |
SoilCO2_West_A_4 |
SoilCO2_West_B_4 |
SoilCO2_West_C_4 |
Avg | Spacial Count |
Measurement Count |
|---|---|---|---|---|---|---|---|---|---|---|---|---|---|---|---|---|---|---|---|---|---|---|---|---|---|---|---|---|---|---|---|---|---|---|---|---|---|---|---|---|---|---|---|---|---|---|---|---|---|---|---|---|---|---|
| 2016-03-23 | 83 | 0 | nan | 37.9 | 32.6 | 39.9 | 34.9 | 38.4 | 33.2 | 19.7 | 27.6 | 30.5 | 32.6 | 25.8 | 33.5 | 40.5 | 42.6 | 33.2 | 39 | 39.6 | 33.8 | 32.6 | 31.9 | 25.6 | 31.3 | 25.2 | 31.9 | 41.9 | 42.1 | 39.8 | 43 | 46 | 38 | 32.7 | 34.3 | 34.6 | 38.2 | 37.1 | 39.8 | 41.4 | 61.5 | 41.4 | 45.4 | 42.8 | 35.5 | 45.7 | 48.8 | 34.5 | 46.6 | 53.1 | 41.4 | |||
| 2016-03-23 | 83 | 1 | nan | 37 | 32 | 39.9 | 34.3 | 39.9 | 33.8 | 19.7 | 26.7 | 29.7 | 31.4 | 26.4 | 32.9 | 40.2 | 42.4 | 32.3 | 38.7 | 37.4 | 33.2 | 32.6 | 31.6 | 24.9 | 30.7 | 24.9 | 32.3 | 41 | 41.9 | 39.8 | 42.7 | 46.6 | 37.4 | 32.7 | 35.2 | 35.4 | 36.3 | 36.8 | 31 | 42 | 59.4 | 41.4 | 43.4 | 42 | 36.8 | 46 | 49.4 | 35.4 | 46.6 | 53.7 | 41.4 | |||
| 2016-03-23 | 83 | Avg | 0-15cm | 0 | 0 | |||||||||||||||||||||||||||||||||||||||||||||||||
| 2016-03-23 | 83 | Avg | 15-30cm | 0 | 0 | |||||||||||||||||||||||||||||||||||||||||||||||||
| 2016-03-23 | 83 | Avg | 30-45cm | 0 | 0 | |||||||||||||||||||||||||||||||||||||||||||||||||
| 2016-03-23 | 83 | Avg | 45-60cm | 0 | 0 |
mode = both
Moisture Point Probes VR
Array
(
[0] => Solar_Panels_1
[1] => Flux_Tower_1
[2] => Gate_1
[3] => Biomass_Cage_1
[4] => Solar_Panels_2
[5] => Flux_Tower_2
[6] => Gate_2
[7] => Biomass_Cage_2
[8] => Solar_Panels_3
[9] => Flux_Tower_3
[10] => Gate_3
[11] => Biomass_Cage_3
[12] => Solar_Panels_4
[13] => Flux_Tower_4
[14] => Gate_4
[15] => Biomass_Cage_4
)
| Date | DOY | Rep | Depth | Solar_Panels_1 |
Flux_Tower_1 |
Gate_1 |
Biomass_Cage_1 |
Solar_Panels_2 |
Flux_Tower_2 |
Gate_2 |
Biomass_Cage_2 |
Solar_Panels_3 |
Flux_Tower_3 |
Gate_3 |
Biomass_Cage_3 |
Solar_Panels_4 |
Flux_Tower_4 |
Gate_4 |
Biomass_Cage_4 |
Avg | Spacial Count |
Measurement Count |
|---|---|---|---|---|---|---|---|---|---|---|---|---|---|---|---|---|---|---|---|---|---|---|
| 2016-03-23 | 83 | 0 | nan | 27.6 | 25.8 | 25 | 12.4 | 26.1 | 28.9 | 21.6 | 23.7 | 31 | 16.5 | 25.7 | 31.5 | 41.4 | 29.7 | 21.6 | 31.9 | |||
| 2016-03-23 | 83 | 1 | nan | 26.4 | 25.8 | 25.8 | 12.7 | 24.9 | 29.2 | 21.6 | 23.7 | 30.7 | 16.5 | 25.7 | 31.3 | 41.4 | 29.9 | 20.8 | 33.1 | |||
| 2016-03-23 | 83 | Avg | 0-15cm | 0 | 0 | |||||||||||||||||
| 2016-03-23 | 83 | Avg | 15-30cm | 0 | 0 | |||||||||||||||||
| 2016-03-23 | 83 | Avg | 30-45cm | 0 | 0 | |||||||||||||||||
| 2016-03-23 | 83 | Avg | 45-60cm | 0 | 0 |
Grass Height TZ 12
| Date | Height reps (cm) | Location | Average | Samp | STDEV | |||||||||||
|---|---|---|---|---|---|---|---|---|---|---|---|---|---|---|---|---|
| 2016-03-23 | 26 | 16 | 13 | 18 | 10 | 20 | 8 | 7 | 8 | 13 | 7 | 8 | GH_ALL | 11.39 | 18 | 5.31 |
Grass Height VR 22
| Date | Height reps (cm) | Location | Average | Samp | STDEV | |||||||||||||||||||||
|---|---|---|---|---|---|---|---|---|---|---|---|---|---|---|---|---|---|---|---|---|---|---|---|---|---|---|
| 2016-03-23 | 20 | 20 | 10 | 5 | 33 | 10 | 8 | 10 | 9 | 11 | 7 | 8 | 7 | 12 | 6 | 7 | 16 | 12 | 18 | 10 | 9 | 11 | GH_ALL | 11.77 | 22 | 6.21 |
Tree DBH
| Date | Tag# | Reading (mm) |
|---|---|---|
| 2016-03-23 | 1 | 19.6 |
| 2016-03-23 | 102 | 17.1 |
| 2016-03-23 | 2 | 17.4 |
| 2016-03-23 | 245 | 22.8 |
| 2016-03-23 | 3 | 20.0 |
| 2016-03-23 | 4 | 14.5 |
| 2016-03-23 | 5 | 17.0 |
| 2016-03-23 | 62 | 22.3 |
| 2016-03-23 | 7 | 14.3 |
| 2016-03-23 | 79 | 21.3 |
| 2016-03-23 | 8 | 17.4 |
No water potential data found
No TZ Grass Biomass data found
No TZ OakLeaves Biomass data found
No TZ PineNeedles Biomass data found
1 photos found
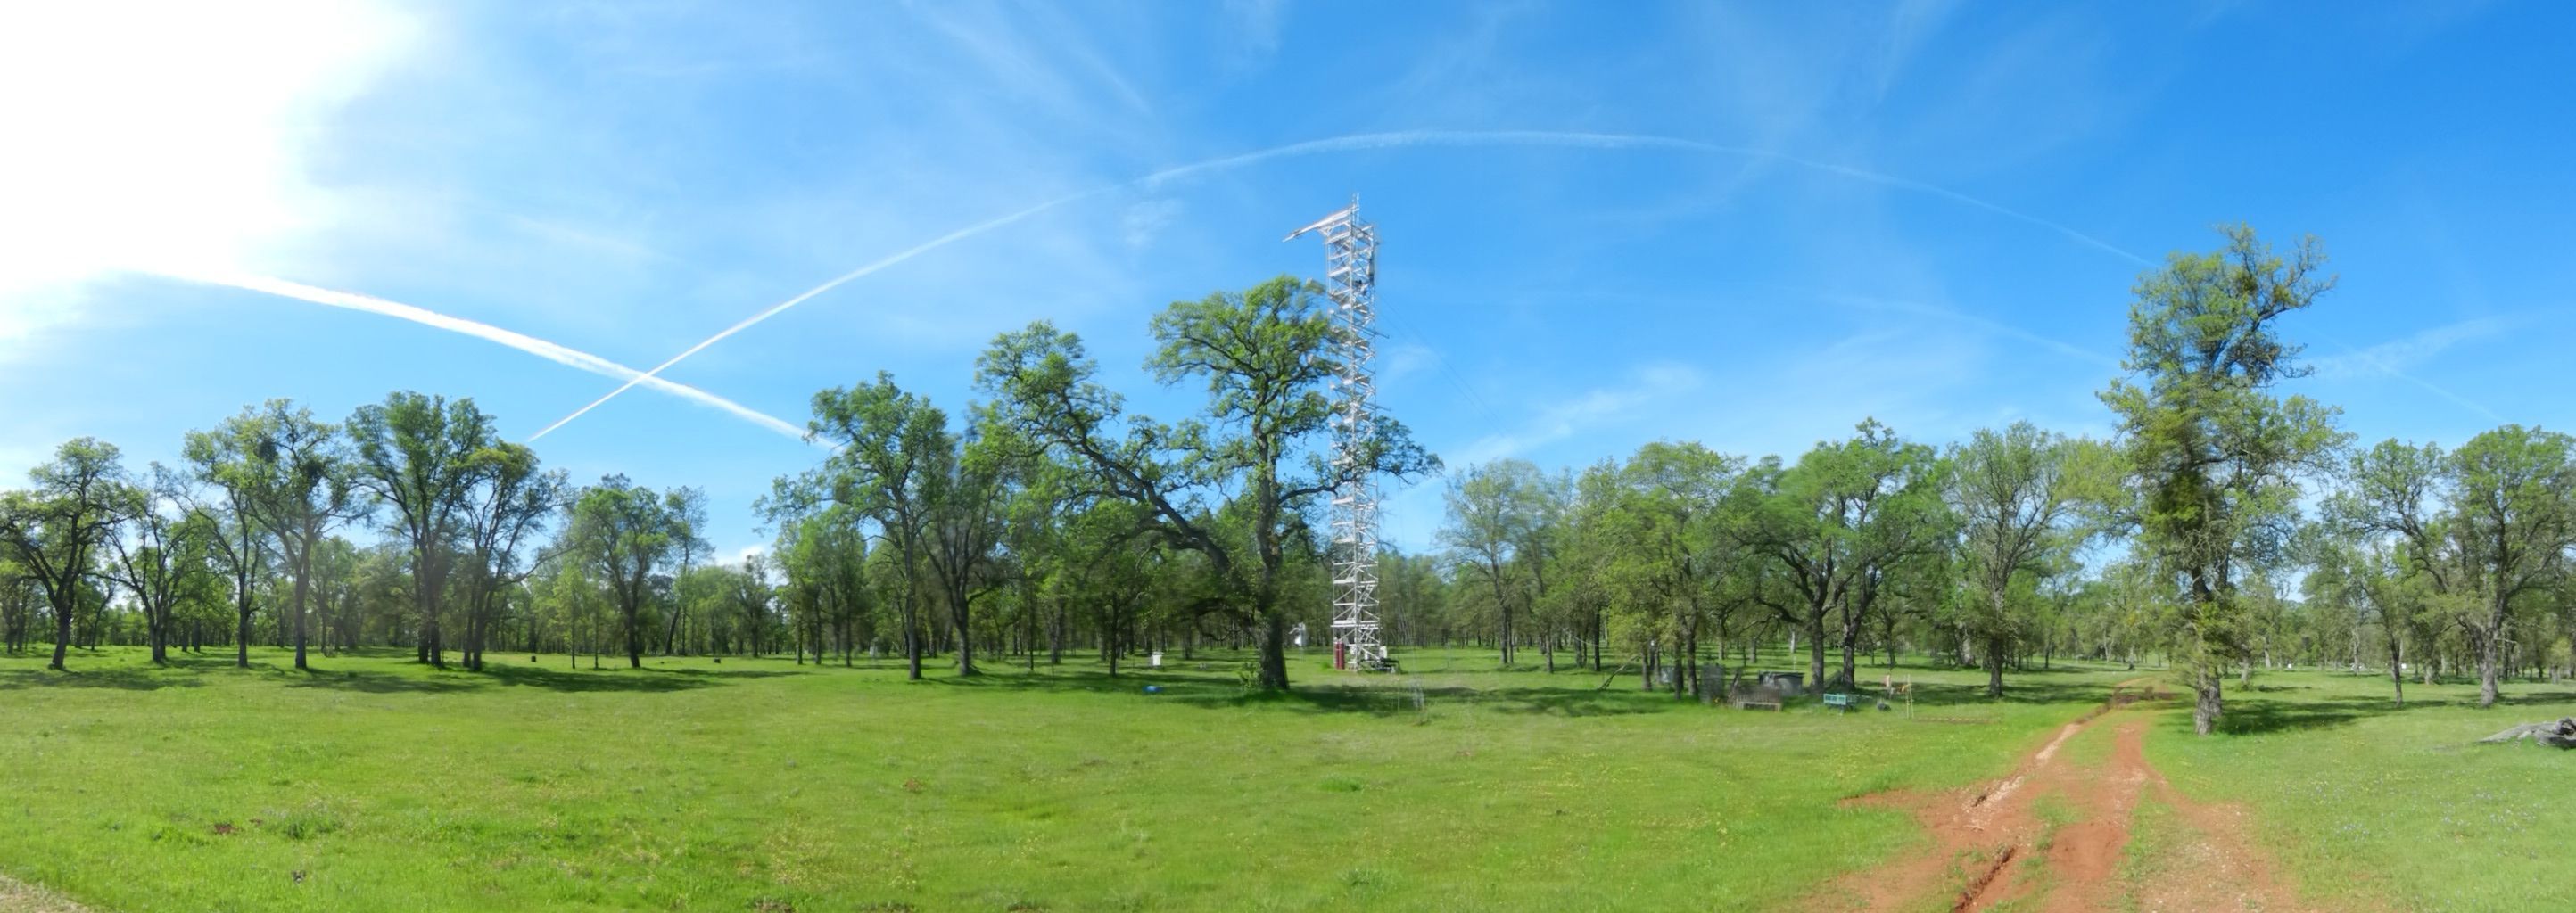
20160323TZ_SitePano.jpg ( 2016-03-23 11:43:29 ) Full size: 2888x1024
Bright green grass and bright green leaves on trees
16 sets found
No data found for TZ_Fenergy.
11 TZ_tmet graphs found
11 TZ_soilco2 graphs found
Can't check TZ_mixed
3 TZ_mixed graphs found
1 TZ_fflux graphs found
8 TZ_fmet graphs found
No data found for TZ_tram.
No data found for TZ_co2prof.
1 TZ_irt graphs found
No data found for TZ_windprof.
1 TZ_tflux graphs found
2 TZ_sm graphs found
Can't check TZ_met
1 TZ_met graphs found
Can't check TZVR_mixed
No data found for TZ_osu.
No data found for TZ_fd.
Tonzi Z-cam data