
Field Notes
<--2016-03-08 09:30:00 | 2016-03-23 10:00:00-->Other sites visited today: Vaira | Tonzi
Phenocam link: Searching...
Tonzi: 2016-03-23 09:00:00 (DOY 83)
Author: Siyan Ma
Others: Joe
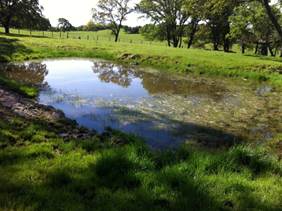
Summary: Beautiful day, Standard field work
|
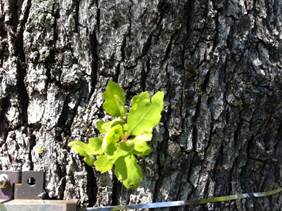
When: Date: 3/23/2016 , Day: 83 , Watch Time: 9:00 am . Where: Tonzi/Vaira Ranch Who: Siyan, Joe Weather: a beautiful spring day; clear, sunny Phenology: oak leaves didn’t look growing very much since they came out a couple of weeks ago. Maybe due to raining -> low temperatures. Grasses are growing fast, about 10 – 20 cm high.
Summary
Vaira_Grass Site
Tonzi_Tower Site
8. closed gate and set up fence. YES! Toniz_Floor Site
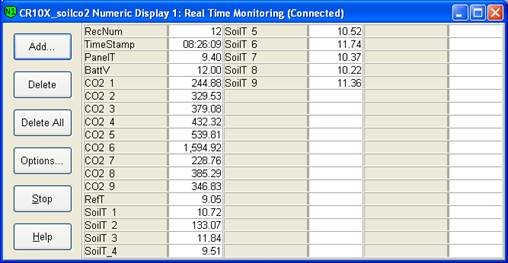
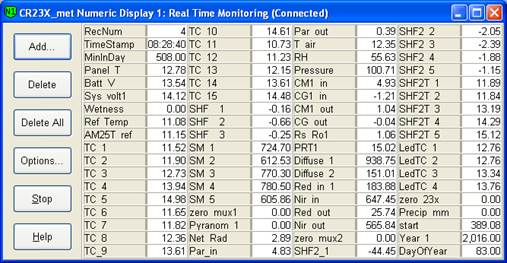
CR23X3 – floor-Met; CR23X6 – tower-Met; CR10X2 – floor-Met; CR23X5 – soil CO2 profile: 3 probes at Open site had no readings because the power switch was broken; Joe took it back to the lab.
|
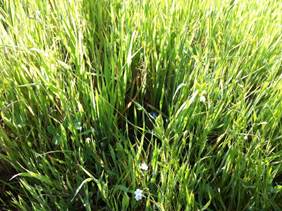
Veg Height (cm): Tape measure from ground to top of plant
8, 26, 7, 16, 8, 13, 13, 18, 7, 10, 8, 20, 8, 7, 8, 13, 7, 8, avg = 11.4, stdev = 5.47
Field Data
No tank data
Well Depth
| Date | Location | Depth (feet) |
|---|---|---|
| 2016-03-23 | TZ_floor | 27.9 |
| 2016-03-23 | TZ_road | 32.3 |
| 2016-03-23 | TZ_tower | 27.9 |
mode = both
Moisture Point Probes TZ
Array
(
[0] => Tower_1
[1] => Floor_South_1
[2] => Floor_East_1
[3] => Floor_West_1
[4] => SoilCO2_1
[5] => Soil_Transect_4_1
[6] => Soil_Transect_3_1
[7] => Soil_Transect_2_1
[8] => Soil_Transect_1_1
[9] => SoilCO2_West_A_1
[10] => SoilCO2_West_B_1
[11] => SoilCO2_West_C_1
[12] => Tower_2
[13] => Floor_South_2
[14] => Floor_East_2
[15] => Floor_West_2
[16] => SoilCO2_2
[17] => Soil_Transect_4_2
[18] => Soil_Transect_3_2
[19] => Soil_Transect_2_2
[20] => Soil_Transect_1_2
[21] => SoilCO2_West_A_2
[22] => SoilCO2_West_B_2
[23] => SoilCO2_West_C_2
[24] => Tower_3
[25] => Floor_South_3
[26] => Floor_East_3
[27] => Floor_West_3
[28] => SoilCO2_3
[29] => Soil_Transect_4_3
[30] => Soil_Transect_3_3
[31] => Soil_Transect_2_3
[32] => Soil_Transect_1_3
[33] => SoilCO2_West_A_3
[34] => SoilCO2_West_B_3
[35] => SoilCO2_West_C_3
[36] => Tower_4
[37] => Floor_South_4
[38] => Floor_East_4
[39] => Floor_West_4
[40] => SoilCO2_4
[41] => Soil_Transect_4_4
[42] => Soil_Transect_3_4
[43] => Soil_Transect_2_4
[44] => Soil_Transect_1_4
[45] => SoilCO2_West_A_4
[46] => SoilCO2_West_B_4
[47] => SoilCO2_West_C_4
)
| Date | DOY | Rep | Depth | Tower_1 |
Floor_South_1 |
Floor_East_1 |
Floor_West_1 |
SoilCO2_1 |
Soil_Transect_4_1 |
Soil_Transect_3_1 |
Soil_Transect_2_1 |
Soil_Transect_1_1 |
SoilCO2_West_A_1 |
SoilCO2_West_B_1 |
SoilCO2_West_C_1 |
Tower_2 |
Floor_South_2 |
Floor_East_2 |
Floor_West_2 |
SoilCO2_2 |
Soil_Transect_4_2 |
Soil_Transect_3_2 |
Soil_Transect_2_2 |
Soil_Transect_1_2 |
SoilCO2_West_A_2 |
SoilCO2_West_B_2 |
SoilCO2_West_C_2 |
Tower_3 |
Floor_South_3 |
Floor_East_3 |
Floor_West_3 |
SoilCO2_3 |
Soil_Transect_4_3 |
Soil_Transect_3_3 |
Soil_Transect_2_3 |
Soil_Transect_1_3 |
SoilCO2_West_A_3 |
SoilCO2_West_B_3 |
SoilCO2_West_C_3 |
Tower_4 |
Floor_South_4 |
Floor_East_4 |
Floor_West_4 |
SoilCO2_4 |
Soil_Transect_4_4 |
Soil_Transect_3_4 |
Soil_Transect_2_4 |
Soil_Transect_1_4 |
SoilCO2_West_A_4 |
SoilCO2_West_B_4 |
SoilCO2_West_C_4 |
Avg | Spacial Count |
Measurement Count |
|---|---|---|---|---|---|---|---|---|---|---|---|---|---|---|---|---|---|---|---|---|---|---|---|---|---|---|---|---|---|---|---|---|---|---|---|---|---|---|---|---|---|---|---|---|---|---|---|---|---|---|---|---|---|---|
| 2016-03-23 | 83 | 0 | nan | 37.9 | 32.6 | 39.9 | 34.9 | 38.4 | 33.2 | 19.7 | 27.6 | 30.5 | 32.6 | 25.8 | 33.5 | 40.5 | 42.6 | 33.2 | 39 | 39.6 | 33.8 | 32.6 | 31.9 | 25.6 | 31.3 | 25.2 | 31.9 | 41.9 | 42.1 | 39.8 | 43 | 46 | 38 | 32.7 | 34.3 | 34.6 | 38.2 | 37.1 | 39.8 | 41.4 | 61.5 | 41.4 | 45.4 | 42.8 | 35.5 | 45.7 | 48.8 | 34.5 | 46.6 | 53.1 | 41.4 | |||
| 2016-03-23 | 83 | 1 | nan | 37 | 32 | 39.9 | 34.3 | 39.9 | 33.8 | 19.7 | 26.7 | 29.7 | 31.4 | 26.4 | 32.9 | 40.2 | 42.4 | 32.3 | 38.7 | 37.4 | 33.2 | 32.6 | 31.6 | 24.9 | 30.7 | 24.9 | 32.3 | 41 | 41.9 | 39.8 | 42.7 | 46.6 | 37.4 | 32.7 | 35.2 | 35.4 | 36.3 | 36.8 | 31 | 42 | 59.4 | 41.4 | 43.4 | 42 | 36.8 | 46 | 49.4 | 35.4 | 46.6 | 53.7 | 41.4 | |||
| 2016-03-23 | 83 | Avg | 0-15cm | 0 | 0 | |||||||||||||||||||||||||||||||||||||||||||||||||
| 2016-03-23 | 83 | Avg | 15-30cm | 0 | 0 | |||||||||||||||||||||||||||||||||||||||||||||||||
| 2016-03-23 | 83 | Avg | 30-45cm | 0 | 0 | |||||||||||||||||||||||||||||||||||||||||||||||||
| 2016-03-23 | 83 | Avg | 45-60cm | 0 | 0 |
mode = both
Moisture Point Probes VR
Array
(
[0] => Solar_Panels_1
[1] => Flux_Tower_1
[2] => Gate_1
[3] => Biomass_Cage_1
[4] => Solar_Panels_2
[5] => Flux_Tower_2
[6] => Gate_2
[7] => Biomass_Cage_2
[8] => Solar_Panels_3
[9] => Flux_Tower_3
[10] => Gate_3
[11] => Biomass_Cage_3
[12] => Solar_Panels_4
[13] => Flux_Tower_4
[14] => Gate_4
[15] => Biomass_Cage_4
)
| Date | DOY | Rep | Depth | Solar_Panels_1 |
Flux_Tower_1 |
Gate_1 |
Biomass_Cage_1 |
Solar_Panels_2 |
Flux_Tower_2 |
Gate_2 |
Biomass_Cage_2 |
Solar_Panels_3 |
Flux_Tower_3 |
Gate_3 |
Biomass_Cage_3 |
Solar_Panels_4 |
Flux_Tower_4 |
Gate_4 |
Biomass_Cage_4 |
Avg | Spacial Count |
Measurement Count |
|---|---|---|---|---|---|---|---|---|---|---|---|---|---|---|---|---|---|---|---|---|---|---|
| 2016-03-23 | 83 | 0 | nan | 27.6 | 25.8 | 25 | 12.4 | 26.1 | 28.9 | 21.6 | 23.7 | 31 | 16.5 | 25.7 | 31.5 | 41.4 | 29.7 | 21.6 | 31.9 | |||
| 2016-03-23 | 83 | 1 | nan | 26.4 | 25.8 | 25.8 | 12.7 | 24.9 | 29.2 | 21.6 | 23.7 | 30.7 | 16.5 | 25.7 | 31.3 | 41.4 | 29.9 | 20.8 | 33.1 | |||
| 2016-03-23 | 83 | Avg | 0-15cm | 0 | 0 | |||||||||||||||||
| 2016-03-23 | 83 | Avg | 15-30cm | 0 | 0 | |||||||||||||||||
| 2016-03-23 | 83 | Avg | 30-45cm | 0 | 0 | |||||||||||||||||
| 2016-03-23 | 83 | Avg | 45-60cm | 0 | 0 |
Grass Height TZ 12
| Date | Height reps (cm) | Location | Average | Samp | STDEV | |||||||||||
|---|---|---|---|---|---|---|---|---|---|---|---|---|---|---|---|---|
| 2016-03-23 | 26 | 16 | 13 | 18 | 10 | 20 | 8 | 7 | 8 | 13 | 7 | 8 | GH_ALL | 11.39 | 18 | 5.31 |
Grass Height VR 22
| Date | Height reps (cm) | Location | Average | Samp | STDEV | |||||||||||||||||||||
|---|---|---|---|---|---|---|---|---|---|---|---|---|---|---|---|---|---|---|---|---|---|---|---|---|---|---|
| 2016-03-23 | 20 | 20 | 10 | 5 | 33 | 10 | 8 | 10 | 9 | 11 | 7 | 8 | 7 | 12 | 6 | 7 | 16 | 12 | 18 | 10 | 9 | 11 | GH_ALL | 11.77 | 22 | 6.21 |
Tree DBH
| Date | Tag# | Reading (mm) |
|---|---|---|
| 2016-03-23 | 1 | 19.6 |
| 2016-03-23 | 102 | 17.1 |
| 2016-03-23 | 2 | 17.4 |
| 2016-03-23 | 245 | 22.8 |
| 2016-03-23 | 3 | 20.0 |
| 2016-03-23 | 4 | 14.5 |
| 2016-03-23 | 5 | 17.0 |
| 2016-03-23 | 62 | 22.3 |
| 2016-03-23 | 7 | 14.3 |
| 2016-03-23 | 79 | 21.3 |
| 2016-03-23 | 8 | 17.4 |
No water potential data found
No TZ Grass Biomass data found
No TZ OakLeaves Biomass data found
No TZ PineNeedles Biomass data found
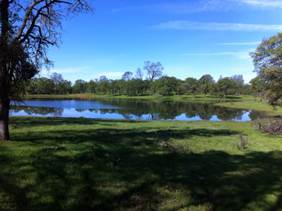
1 photos found
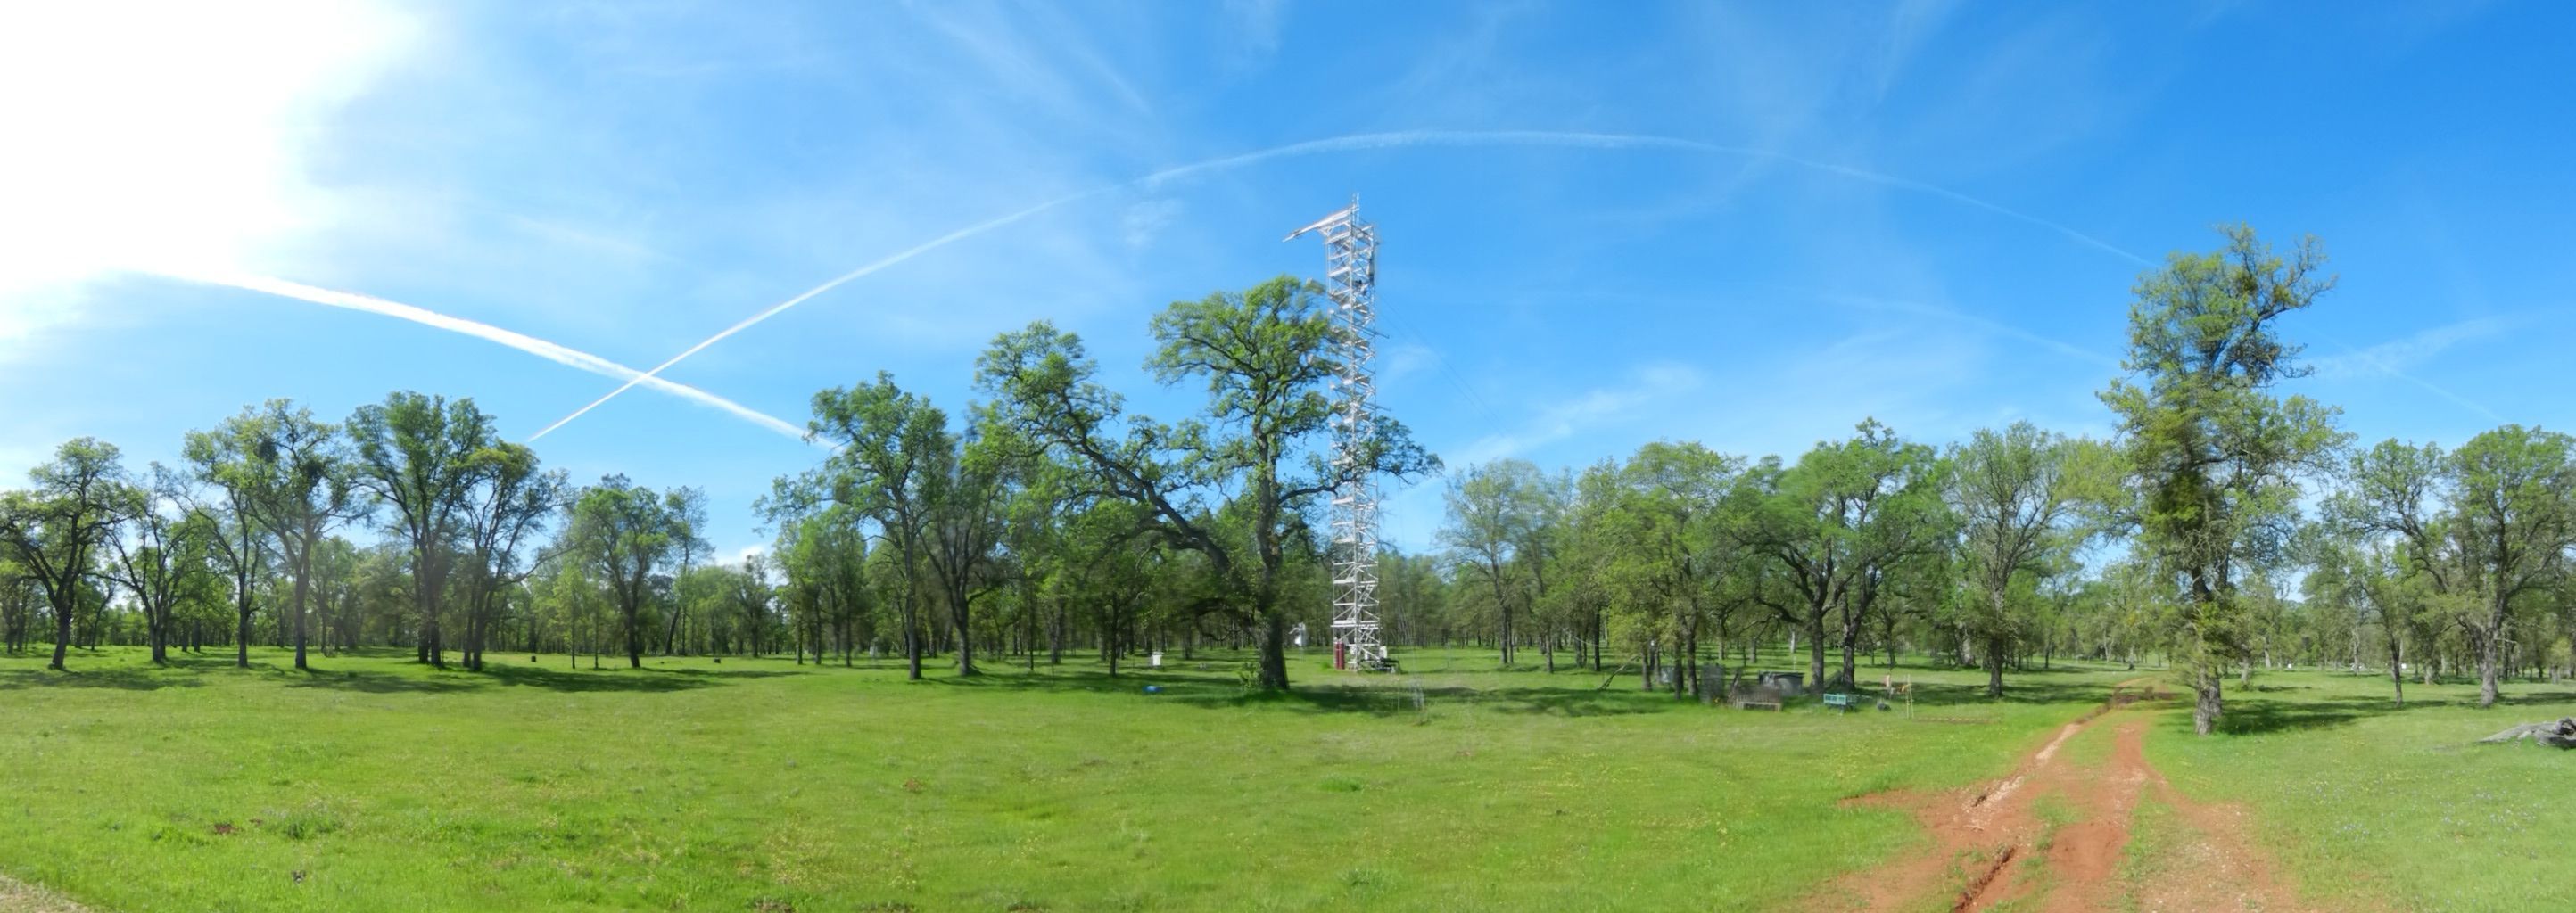
20160323TZ_SitePano.jpg ( 2016-03-23 11:43:29 ) Full size: 2888x1024
Bright green grass and bright green leaves on trees
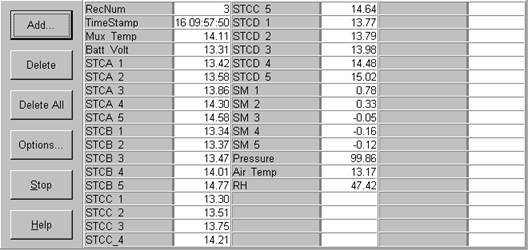
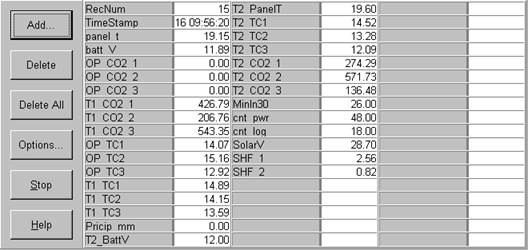
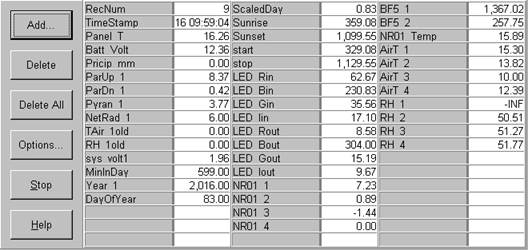
16 sets found
No data found for TZ_Fenergy.
11 TZ_tmet graphs found
11 TZ_soilco2 graphs found
Can't check TZ_mixed
3 TZ_mixed graphs found
1 TZ_fflux graphs found
8 TZ_fmet graphs found
No data found for TZ_tram.
No data found for TZ_co2prof.
1 TZ_irt graphs found
No data found for TZ_windprof.
1 TZ_tflux graphs found
2 TZ_sm graphs found
Can't check TZ_met
1 TZ_met graphs found
Can't check TZVR_mixed
No data found for TZ_osu.
No data found for TZ_fd.
Tonzi Z-cam data