Field Notes

<--2015-10-29 12:50:00 | 2015-11-20 08:15:00-->
Other sites visited today: Mayberry | Twitchell Rice | West Pond | Twitchell Alfalfa
Phenocam link: Searching...

East End: 2015-11-11 12:00:00 (DOY 315)
Author: Joe Verfaillie
Others: Kyle

Summary: Standard data collection, checked DO sensor, low power issues here.

East End
2015-11-11

I arrived about 12:00 with Kyle. It was clear, sunny and mild with light variable breeze. The otters continue to poop on our boardwalk. Next time I think I will try setting the boardwalk on edge when we leave. The vegetation is turning yellow.

The 7700 read: 2.15ppm CH4, 66RSSI – 82 after cleaning
The 7500 read: 432ppm CO2, 467mmol/m3, 89.2SS, 14.3C, 102.9kPa

Not too many spider webs here. The wash reservoir was about half full – refilled.

The camera was off. Power has been out a couple of times. This site has two solar panels and four batteries. We should add a third panel and two more batteries next time. We might need to swap out the old batteries.

We cleaned the DO sensor and took a reading in the air.
DO 15.54mV
Tair 14.50C
P 102.99 kPa

1 photos found

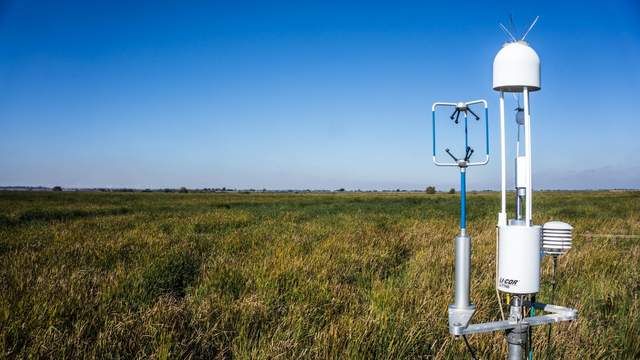
Eddy sensors over mostly green wetland
20151111EE_Site.jpg ( 2015-11-11 16:16:23 ) Full size: 1920x1080
Eddy sensors over mostly green wetland

Graphs display:
11 sets found

14 EE_met graphs found

Explore the graph:Temperature and Batt V in a new window

Explore the graph:Soil Moisture and Well Pressure in a new window

Explore the graph:Solar Radiation in a new window

Explore the graph:PAR in a new window

Explore the graph:Soil Heat Flux in a new window

Explore the graph:Water Level and Rain in a new window

Explore the graph:Soil/Water Temperature Set 1 in a new window

Explore the graph:Soil/Water Temperature Set 2 in a new window

Explore the graph:Soil/Water Temperature Set 3 in a new window

Explore the graph:Dissolved Oxygen and Wind Speed in a new window

Explore the graph:SRS NDVI Channels in a new window

Explore the graph:Apogee NDVI in a new window

Explore the graph:NDVI in a new window

Explore the graph:Undercanopy PAR in a new window

Can't check EE_mixed
1 EE_mixed graphs found

Explore the graph:Air Pressure and RH in a new window

8 EE_flux graphs found

Explore the graph:Wind Speeds in a new window

Explore the graph:LI7500 CO2 and H2O in a new window

Explore the graph:LI7700 CH4 and RSSI in a new window

Explore the graph:Flux Counts in a new window

Explore the graph:Instument Temperatures in a new window

Explore the graph:Temp Tower 3 (Mixed Veg) in a new window

Explore the graph:Temp Tower 3 (Mixed Veg) in a new window

Explore the graph:Temp Tower 3 (Mixed Veg) in a new window

Can't check MBWPEESWGT_mixed
1 EE_cam graphs found

Explore the graph:EE Autocam GCC in a new window

Can't check MBEEWPSWEPGT_cam
Can't check SIMBTWEE_met
Can't check EE_Temp
5 EE_Temp graphs found

Explore the graph:Sonic SOS in a new window

Explore the graph:LI7500 CO2 in a new window

Explore the graph:Water Level in a new window

Explore the graph:LI-7700 CH4 in a new window

Explore the graph:Wind Speed in a new window

Can't check EE_minidot
1 EE_minidot graphs found

Explore the graph:EE miniDOT Dissolved Oxygen in a new window

Can't check MBSWEEWPBCBA
1 EE_processed graphs found

Explore the graph:CO2 Fluxes in a new window