
Field Notes
<--2015-03-02 10:00:00 | 2015-05-20 10:00:00-->Other sites visited today: Tonzi | Tonzi
Phenocam link: Searching...
Vaira: 2015-05-06 10:30:00 (DOY 126)
Author: Joe Verfaillie
Others: Siyan, Dennis, Ana
Summary: Standard fieldwork, swapped broken HMP45 fan, removed old, unused solar panels.
| Vaira 2014-05-06 I arrived about 10:30 with Siyan, Dennis and Ana. It was a beautiful, sunny day with a nice breeze. The grass is still green in the low spots but the ground is dry. The water hole still is full. Dennis did grass height and Moisture Point. Ana did clip plots and cleaned the radiometers and camera window. Siyan downloaded the data and did spectral measurements. I swapped the fan on the HMP45 and cleaned weeds from around the base of the solar panels. I removes two small solar panels that used to power the CR23X. The CR1000 card took a little long to format. |
Veg Height (cm): Tape measure from ground to top of plant
50, 40, 37, 42, 48, 62, 40, 50, 68, 75, 50, 54, 45, 53, 25, 37, 33, 33, 44, 36, 78, 40, avg = 47.3, stdev = 13.64
Field Data
No tank data
Well Depth
| Date | Location | Depth (feet) |
|---|---|---|
| 2015-05-06 | TZ_floor | 27.6 |
| 2015-05-06 | TZ_road | 36.3 |
| 2015-05-06 | TZ_tower | 31.3 |
mode = both
Moisture Point Probes TZ
Array
(
[0] => Tower_1
[1] => Floor_South_1
[2] => Floor_East_1
[3] => Floor_West_1
[4] => SoilCO2_1
[5] => Soil_Transect_4_1
[6] => Soil_Transect_3_1
[7] => Soil_Transect_2_1
[8] => Soil_Transect_1_1
[9] => SoilCO2_West_A_1
[10] => SoilCO2_West_B_1
[11] => SoilCO2_West_C_1
[12] => Tower_2
[13] => Floor_South_2
[14] => Floor_East_2
[15] => Floor_West_2
[16] => SoilCO2_2
[17] => Soil_Transect_4_2
[18] => Soil_Transect_3_2
[19] => Soil_Transect_2_2
[20] => Soil_Transect_1_2
[21] => SoilCO2_West_A_2
[22] => SoilCO2_West_B_2
[23] => SoilCO2_West_C_2
[24] => Tower_3
[25] => Floor_South_3
[26] => Floor_East_3
[27] => Floor_West_3
[28] => SoilCO2_3
[29] => Soil_Transect_4_3
[30] => Soil_Transect_3_3
[31] => Soil_Transect_2_3
[32] => Soil_Transect_1_3
[33] => SoilCO2_West_A_3
[34] => SoilCO2_West_B_3
[35] => SoilCO2_West_C_3
[36] => Tower_4
[37] => Floor_South_4
[38] => Floor_East_4
[39] => Floor_West_4
[40] => SoilCO2_4
[41] => Soil_Transect_4_4
[42] => Soil_Transect_3_4
[43] => Soil_Transect_2_4
[44] => Soil_Transect_1_4
[45] => SoilCO2_West_A_4
[46] => SoilCO2_West_B_4
[47] => SoilCO2_West_C_4
)
| Date | DOY | Rep | Depth | Tower_1 |
Floor_South_1 |
Floor_East_1 |
Floor_West_1 |
SoilCO2_1 |
Soil_Transect_4_1 |
Soil_Transect_3_1 |
Soil_Transect_2_1 |
Soil_Transect_1_1 |
SoilCO2_West_A_1 |
SoilCO2_West_B_1 |
SoilCO2_West_C_1 |
Tower_2 |
Floor_South_2 |
Floor_East_2 |
Floor_West_2 |
SoilCO2_2 |
Soil_Transect_4_2 |
Soil_Transect_3_2 |
Soil_Transect_2_2 |
Soil_Transect_1_2 |
SoilCO2_West_A_2 |
SoilCO2_West_B_2 |
SoilCO2_West_C_2 |
Tower_3 |
Floor_South_3 |
Floor_East_3 |
Floor_West_3 |
SoilCO2_3 |
Soil_Transect_4_3 |
Soil_Transect_3_3 |
Soil_Transect_2_3 |
Soil_Transect_1_3 |
SoilCO2_West_A_3 |
SoilCO2_West_B_3 |
SoilCO2_West_C_3 |
Tower_4 |
Floor_South_4 |
Floor_East_4 |
Floor_West_4 |
SoilCO2_4 |
Soil_Transect_4_4 |
Soil_Transect_3_4 |
Soil_Transect_2_4 |
Soil_Transect_1_4 |
SoilCO2_West_A_4 |
SoilCO2_West_B_4 |
SoilCO2_West_C_4 |
Avg | Spacial Count |
Measurement Count |
|---|---|---|---|---|---|---|---|---|---|---|---|---|---|---|---|---|---|---|---|---|---|---|---|---|---|---|---|---|---|---|---|---|---|---|---|---|---|---|---|---|---|---|---|---|---|---|---|---|---|---|---|---|---|---|
| 2015-05-06 | 126 | 0 | nan | 8.3 | 6.8 | 39.9 | 13.8 | 11.1 | 4.7 | 9.7 | 8.6 | 7.7 | 13.2 | 7.7 | 6.2 | 10.9 | 14.8 | 14.5 | 9 | 14.5 | 12.1 | 16.7 | 16.4 | 6.3 | 12.4 | 2 | 14.8 | 15.6 | 14.5 | 39.6 | 19.8 | 16.5 | 11.5 | 18.2 | 20.9 | 16.5 | 20.4 | 18.4 | 16.5 | 11.9 | 13.6 | 41.4 | 25.6 | 88.7 | 13 | 21.6 | 31.9 | 13.3 | 24.5 | 21.3 | 25.1 | |||
| 2015-05-06 | 126 | 1 | nan | 8 | 6.8 | 39.9 | 13.2 | 11.1 | 4.5 | 10 | 2.1 | 8.6 | 14.4 | 8 | 6.5 | 11.2 | 15.5 | 14.5 | 10.3 | 14.2 | 12.4 | 16.4 | 17 | 6 | 12.7 | 2.3 | 14.5 | 16.5 | 14.8 | 39.6 | 19 | 18.7 | 11.2 | 18.2 | 20.4 | 16.5 | 20.4 | 18.4 | 17.3 | 12.5 | 14.5 | 41.4 | 25.6 | 11.1 | 14.2 | 22.2 | 32.5 | 13.3 | 25.4 | 20.5 | 25.9 | |||
| 2015-05-06 | 126 | 2 | nan | 8 | 6.5 | 39.9 | 11.1 | 11.1 | 9.7 | 8.8 | 7.4 | 13.8 | 8 | 5.6 | 10.9 | 15.2 | 14.8 | 9.7 | 14.8 | 17.3 | 16.7 | 6 | 12.7 | 2 | 14.5 | 16.5 | 14.5 | 39.6 | 19.8 | 16.5 | 18.4 | 20.7 | 16.8 | 19.8 | 18.4 | 17 | 11.6 | 14.5 | 41.4 | 25.6 | 22.4 | 22.8 | 32.2 | 13.6 | 24.8 | 20.5 | 25.9 | |||||||
| 2015-05-06 | 126 | Avg | 0-15cm | 0 | 0 | |||||||||||||||||||||||||||||||||||||||||||||||||
| 2015-05-06 | 126 | Avg | 15-30cm | 0 | 0 | |||||||||||||||||||||||||||||||||||||||||||||||||
| 2015-05-06 | 126 | Avg | 30-45cm | 0 | 0 | |||||||||||||||||||||||||||||||||||||||||||||||||
| 2015-05-06 | 126 | Avg | 45-60cm | 0 | 0 |
mode = both
Moisture Point Probes VR
Array
(
[0] => Solar_Panels_1
[1] => Flux_Tower_1
[2] => Gate_1
[3] => Biomass_Cage_1
[4] => Solar_Panels_2
[5] => Flux_Tower_2
[6] => Gate_2
[7] => Biomass_Cage_2
[8] => Solar_Panels_3
[9] => Flux_Tower_3
[10] => Gate_3
[11] => Biomass_Cage_3
[12] => Solar_Panels_4
[13] => Flux_Tower_4
[14] => Gate_4
[15] => Biomass_Cage_4
)
| Date | DOY | Rep | Depth | Solar_Panels_1 |
Flux_Tower_1 |
Gate_1 |
Biomass_Cage_1 |
Solar_Panels_2 |
Flux_Tower_2 |
Gate_2 |
Biomass_Cage_2 |
Solar_Panels_3 |
Flux_Tower_3 |
Gate_3 |
Biomass_Cage_3 |
Solar_Panels_4 |
Flux_Tower_4 |
Gate_4 |
Biomass_Cage_4 |
Avg | Spacial Count |
Measurement Count |
|---|---|---|---|---|---|---|---|---|---|---|---|---|---|---|---|---|---|---|---|---|---|---|
| 2015-05-06 | 126 | 0 | nan | 39.9 | 39.9 | 4.7 | 39.9 | 50 | 50 | 6.3 | 50 | 16.8 | 39.6 | 39.6 | 39.6 | 41.4 | 13 | 41.4 | 14.5 | |||
| 2015-05-06 | 126 | 1 | nan | 39.9 | 39.9 | 4.7 | 39.9 | 9.7 | 50 | 6.9 | 50 | 17 | 39.6 | 39.6 | 39.6 | 41.4 | 12.6 | 41.4 | 14.2 | |||
| 2015-05-06 | 126 | 2 | nan | 39.9 | 39.9 | 39.9 | 7.2 | 50 | 50 | 15.9 | 39.6 | 39.6 | 41.4 | 12.8 | 14.8 | |||||||
| 2015-05-06 | 126 | Avg | 0-15cm | 0 | 0 | |||||||||||||||||
| 2015-05-06 | 126 | Avg | 15-30cm | 0 | 0 | |||||||||||||||||
| 2015-05-06 | 126 | Avg | 30-45cm | 0 | 0 | |||||||||||||||||
| 2015-05-06 | 126 | Avg | 45-60cm | 0 | 0 |
No TZ grass heigth found
Grass Height VR 22
| Date | Height reps (cm) | Location | Average | Samp | STDEV | |||||||||||||||||||||
|---|---|---|---|---|---|---|---|---|---|---|---|---|---|---|---|---|---|---|---|---|---|---|---|---|---|---|
| 2015-05-06 | 50 | 40 | 37 | 42 | 48 | 62 | 40 | 50 | 68 | 75 | 50 | 54 | 45 | 53 | 25 | 37 | 33 | 33 | 44 | 36 | 78 | 40 | GH_ALL | 47.27 | 22 | 13.32 |
No VR Tree DBH found
No water potential data found
No VR Grass Biomass data found
No VR OakLeaves Biomass data found
No VR PineNeedles Biomass data found
1 photos found
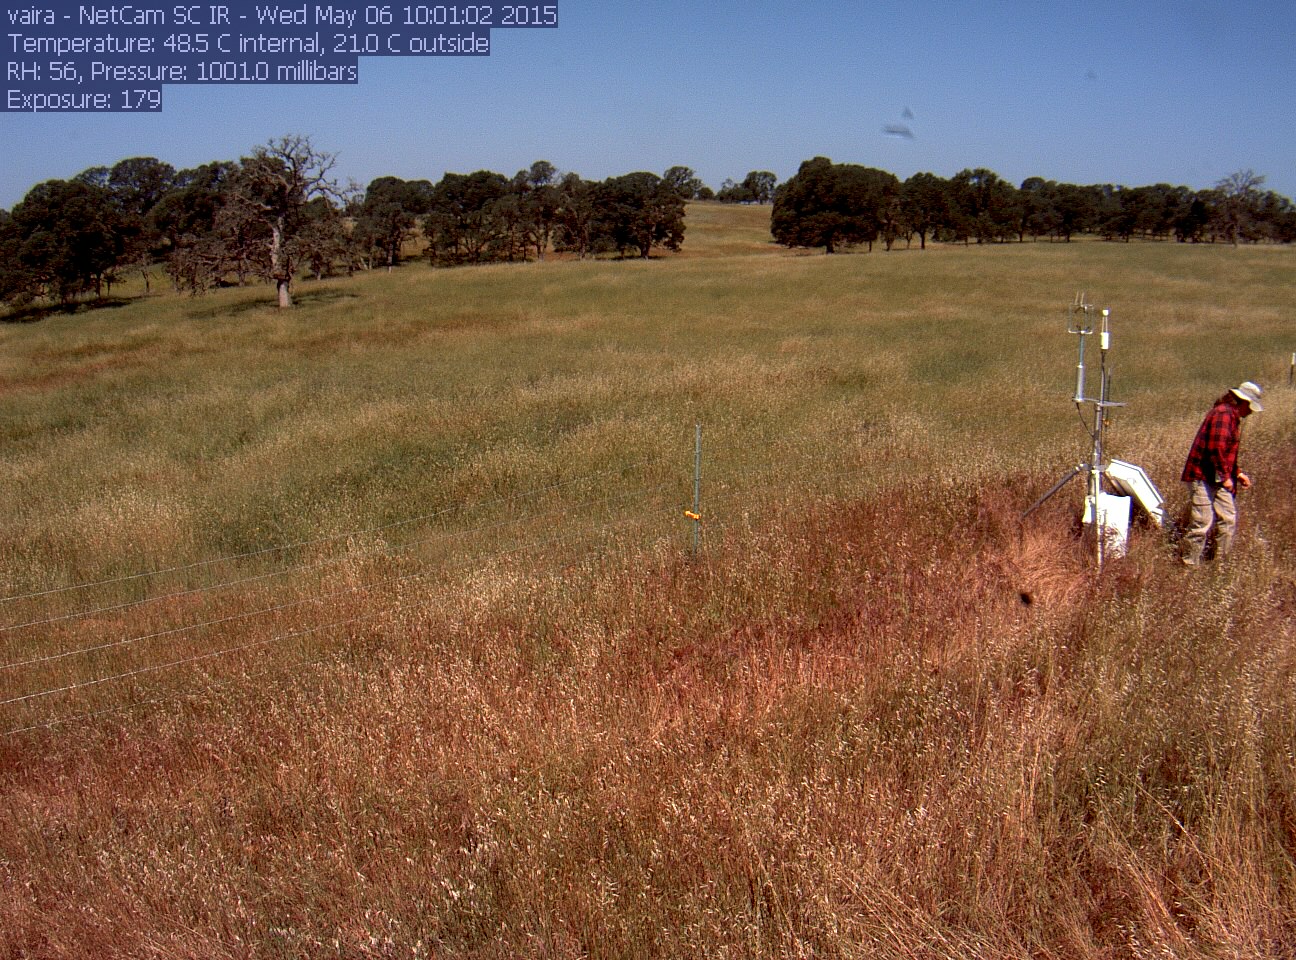
vaira_2015_05_06_100102.jpg ( 2015-05-06 17:53:58 ) Full size: 1296x960
Joe on site
9 sets found
16 VR_met graphs found
2 VR_flux graphs found
6 VR_soilco2 graphs found
No data found for VR_pond.
Can't check TZVR_mixed
No data found for VR_fd.
No data found for VR_processed.
No data found for VR_arable.
No data found for VR_soilvue.