Field Notes
<--2015-03-24 13:45:00 | 2015-04-23 13:00:00-->Other sites visited today: Sherman Island | Mayberry | Twitchell Rice | East End | West Pond
Phenocam link: Searching...
Twitchell Alfalfa: 2015-04-09 10:55:00 (DOY 99)
Author: Cove Sturtevant
Others: Sara
Summary: Regular field work. Data download.
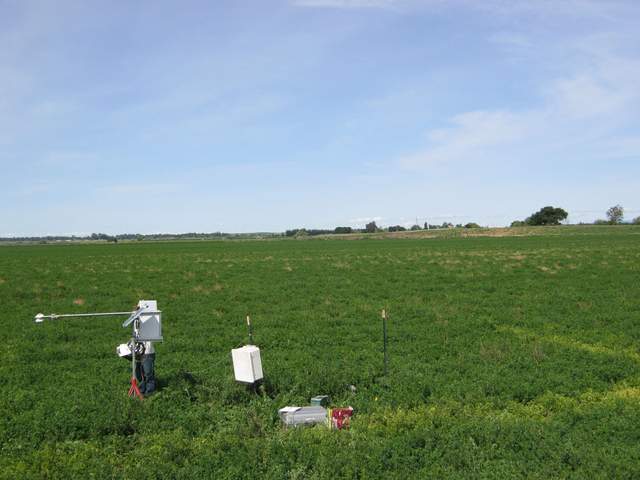
| Twitchell Alfalfa 2015-04-09 We arrived at about 10:55 PDT. Mild and sunny. We were prepared to clip the alfalfa around the soil sensors since it was not grazed by the sheep, but the rest of the field is now almost as high as the ungrazed portion, so we did not clip anything. I downloaded data and did veg height. Sara did soil respiration, spectral, and clip plots. Sara made a note to double check the order of the soil collars with Patty. Soil T_6 is out in the soil CO2 system. FR_RH 3 was reading very low, fixed by reconnecting a loose wire. 7500 readings: CO2 = 406 ppm (same after cleaning) H2O = 470 mmol m-3 (same after cleaning) signal strength = 89.0% (89.5% after cleaning) p = 101.7 kPa t = 17 C sos = 343.2 m s-1 Rad good. Cleaned sensors. Met good. |
Veg Height (cm): Tape measure from ground to top of plant
25, 25, 21, 0, 0, 34, 26, 23, 14, 22, 20, 32, 11, 0, 22, 30, 26, 27, 20, 30, avg = 20.4, stdev = 10.37
1 photos found

TA_autocam_20150409_1015.jpg ( 2015-04-09 10:15:01 ) Full size: 1920x1440
Site visit
7 sets found
Can't check TA_met
11 TA_met graphs found
Can't check TA_rad
3 TA_rad graphs found
Can't check TA_flux
5 TA_flux graphs found
Can't check TA_soilco2
7 TA_soilco2 graphs found
No data found for TA_arable.
1 TA_cam graphs found
Can't check TATWBABCSB_cam

