
Field Notes
<--2014-09-11 09:20:00 | 2014-09-30 09:30:00-->Other sites visited today: Vaira | Tonzi
Phenocam link: Searching...
Tonzi: 2014-09-11 11:00:00 (DOY 254)
Author: Joe Verfaillie
Others: Siyan
Summary: PRI sensors operational, reinstalled LI-820 but still some plumbing problem, Tower fence down - repaired, missing Tram data, swapped tower 7500.
| Tonzi 2014-09-11 I arrived about 11am with Siyan. It was clear and hot with a little breeze from the west. Most of the trees here have brown leaves. Tonzi’s pond still has water. Last year the pond was almost dry in early November. There were a bunch of cows standing around the watering station. I finished installing the Decagon PRI sensors. They ship with a default SDI address of zero, but the 23x cannot talk to a sensor with a zero address (apparently). I set the incoming sensor sn 759503109 SDI address to 1 in the lab and the reflected one sn 816903083 to SDI address 2. Both seemed to be working, but the PRI calculated with the initial readings was negative. Maybe that will change, or maybe the PRI of area of view is just zero right now. I reinstalled the LI-820 sn CGA-556 in the co2 profile system. The 820 seemed to be okay, but the plumbing seemed to be having problems. The cal gasses dumped into the lowest inlet did not seem to be reaching the analyzer. It seemed like the solenoids were stuck open. I reloaded the 10x program and it looked like it was cycling the ports properly. I let it run and will try to troubleshoot it more next time. Just before leaving I noticed the fence around the tower was down. A big section in the south east corner had been pulled free by cows and there was evidence of cow inside of the fence. I patched it as best I could, but it could use some more work and maybe we could put some flagging on it to make it more visible. Looking at the data, the tram data was largely missing. Maybe the rename program is not working correctly. We swapped the 7500 on the Tower - sn 0418 came off and sn 0976 went on. I serviced the zcams. Cam 1 did not boot properly on the card at first. I ejected the card, unlocked it and relocked it. Then it worked. Siyan did the standard fieldwork plus midday water potential. |
Field Data
No tank data
Well Depth
| Date | Location | Depth (feet) |
|---|---|---|
| 2014-09-11 | TZ_floor | 32.3 |
| 2014-09-11 | TZ_road | 39.3 |
| 2014-09-11 | TZ_tower | 36.3 |
mode = both
Moisture Point Probes TZ
Array
(
[0] => Tower_1
[1] => Floor_South_1
[2] => Floor_West_1
[3] => SoilCO2_1
[4] => Soil_Transect_4_1
[5] => Soil_Transect_3_1
[6] => Soil_Transect_2_1
[7] => Soil_Transect_1_1
[8] => SoilCO2_West_A_1
[9] => SoilCO2_West_B_1
[10] => SoilCO2_West_C_1
[11] => Tower_2
[12] => Floor_South_2
[13] => Floor_East_2
[14] => Floor_West_2
[15] => SoilCO2_2
[16] => Soil_Transect_4_2
[17] => Soil_Transect_3_2
[18] => Soil_Transect_2_2
[19] => Soil_Transect_1_2
[20] => SoilCO2_West_A_2
[21] => SoilCO2_West_B_2
[22] => SoilCO2_West_C_2
[23] => Tower_3
[24] => Floor_South_3
[25] => Floor_East_3
[26] => Floor_West_3
[27] => SoilCO2_3
[28] => Soil_Transect_4_3
[29] => Soil_Transect_3_3
[30] => Soil_Transect_2_3
[31] => Soil_Transect_1_3
[32] => SoilCO2_West_A_3
[33] => SoilCO2_West_B_3
[34] => SoilCO2_West_C_3
[35] => Floor_South_4
[36] => Floor_East_4
[37] => Floor_West_4
[38] => Soil_Transect_4_4
[39] => Soil_Transect_3_4
[40] => Soil_Transect_2_4
[41] => Soil_Transect_1_4
[42] => SoilCO2_West_A_4
[43] => SoilCO2_West_B_4
[44] => SoilCO2_West_C_4
)
| Date | DOY | Rep | Depth | Tower_1 |
Floor_South_1 |
Floor_West_1 |
SoilCO2_1 |
Soil_Transect_4_1 |
Soil_Transect_3_1 |
Soil_Transect_2_1 |
Soil_Transect_1_1 |
SoilCO2_West_A_1 |
SoilCO2_West_B_1 |
SoilCO2_West_C_1 |
Tower_2 |
Floor_South_2 |
Floor_East_2 |
Floor_West_2 |
SoilCO2_2 |
Soil_Transect_4_2 |
Soil_Transect_3_2 |
Soil_Transect_2_2 |
Soil_Transect_1_2 |
SoilCO2_West_A_2 |
SoilCO2_West_B_2 |
SoilCO2_West_C_2 |
Tower_3 |
Floor_South_3 |
Floor_East_3 |
Floor_West_3 |
SoilCO2_3 |
Soil_Transect_4_3 |
Soil_Transect_3_3 |
Soil_Transect_2_3 |
Soil_Transect_1_3 |
SoilCO2_West_A_3 |
SoilCO2_West_B_3 |
SoilCO2_West_C_3 |
Floor_South_4 |
Floor_East_4 |
Floor_West_4 |
Soil_Transect_4_4 |
Soil_Transect_3_4 |
Soil_Transect_2_4 |
Soil_Transect_1_4 |
SoilCO2_West_A_4 |
SoilCO2_West_B_4 |
SoilCO2_West_C_4 |
Avg | Spacial Count |
Measurement Count |
|---|---|---|---|---|---|---|---|---|---|---|---|---|---|---|---|---|---|---|---|---|---|---|---|---|---|---|---|---|---|---|---|---|---|---|---|---|---|---|---|---|---|---|---|---|---|---|---|---|---|---|---|
| 2014-09-11 | 254 | 0 | nan | 7.7 | 7.8 | 11.1 | 1.1 | 1.3 | 6.2 | 1.8 | 0.9 | 5 | 4.7 | 0.1 | 10.3 | 11.5 | 8.1 | 8.7 | 5.4 | 8.1 | 13.3 | 11.2 | 2.6 | 6 | 0.3 | 8.2 | 17.3 | 10.6 | 11.1 | 12.3 | 3.4 | 9.8 | 14.5 | 15.9 | 12.6 | 14.6 | 14.8 | 20.6 | 4.7 | 18.5 | 11.3 | 10.5 | 14.5 | 18.3 | 10.7 | 15.9 | 10.7 | 11 | |||
| 2014-09-11 | 254 | 1 | nan | 6.5 | 1 | 11.1 | 1.3 | 7.1 | 5.3 | 10.3 | 11.5 | 7.5 | 7.8 | 8.7 | 12.7 | 6.9 | 17.9 | 11.2 | 11.1 | 12.6 | 8.4 | 14.5 | 14 | 5.6 | 11.1 | 10.5 | 14.5 | 16.5 | |||||||||||||||||||||||
| 2014-09-11 | 254 | 2 | nan | 8.3 | 9.7 | 17 | |||||||||||||||||||||||||||||||||||||||||||||
| 2014-09-11 | 254 | Avg | 0-15cm | 0 | 0 | ||||||||||||||||||||||||||||||||||||||||||||||
| 2014-09-11 | 254 | Avg | 15-30cm | 0 | 0 | ||||||||||||||||||||||||||||||||||||||||||||||
| 2014-09-11 | 254 | Avg | 30-45cm | 0 | 0 | ||||||||||||||||||||||||||||||||||||||||||||||
| 2014-09-11 | 254 | Avg | 45-60cm | 0 | 0 |
mode = both
Moisture Point Probes VR
Array
(
[0] => Solar_Panels_1
[1] => Flux_Tower_1
[2] => Gate_1
[3] => Biomass_Cage_1
[4] => Solar_Panels_2
[5] => Flux_Tower_2
[6] => Gate_2
[7] => Biomass_Cage_2
[8] => Solar_Panels_3
[9] => Flux_Tower_3
[10] => Gate_3
[11] => Biomass_Cage_3
[12] => Solar_Panels_4
[13] => Flux_Tower_4
[14] => Gate_4
[15] => Biomass_Cage_4
)
| Date | DOY | Rep | Depth | Solar_Panels_1 |
Flux_Tower_1 |
Gate_1 |
Biomass_Cage_1 |
Solar_Panels_2 |
Flux_Tower_2 |
Gate_2 |
Biomass_Cage_2 |
Solar_Panels_3 |
Flux_Tower_3 |
Gate_3 |
Biomass_Cage_3 |
Solar_Panels_4 |
Flux_Tower_4 |
Gate_4 |
Biomass_Cage_4 |
Avg | Spacial Count |
Measurement Count |
|---|---|---|---|---|---|---|---|---|---|---|---|---|---|---|---|---|---|---|---|---|---|---|
| 2014-09-11 | 254 | 0 | nan | 2.5 | 1.5 | 2.1 | 0.1 | 7.5 | 3.9 | 3.2 | 2 | 13.4 | 3.4 | 8.1 | 18.7 | 27.9 | 11.3 | 8.7 | 13.9 | |||
| 2014-09-11 | 254 | 1 | nan | 1.6 | 1.8 | 1.2 | 0.7 | 7.5 | 4.2 | 3.9 | 2.6 | 13.4 | 2.8 | 9 | 11.5 | 27.4 | 11.9 | 7.9 | 15.3 | |||
| 2014-09-11 | 254 | Avg | 0-15cm | 0 | 0 | |||||||||||||||||
| 2014-09-11 | 254 | Avg | 15-30cm | 0 | 0 | |||||||||||||||||
| 2014-09-11 | 254 | Avg | 30-45cm | 0 | 0 | |||||||||||||||||
| 2014-09-11 | 254 | Avg | 45-60cm | 0 | 0 |
No TZ grass heigth found
No VR grass heigth found
Tree DBH
| Date | Tag# | Reading (mm) |
|---|---|---|
| 2014-09-11 | 1 | 5.5 |
| 2014-09-11 | 102 | 5.2 |
| 2014-09-11 | 2 | 10.3 |
| 2014-09-11 | 245 | 17.5 |
| 2014-09-11 | 3 | 8.2 |
| 2014-09-11 | 4 | 8.9 |
| 2014-09-11 | 5 | 11.2 |
| 2014-09-11 | 7 | 8.4 |
| 2014-09-11 | 72 | 17.4 |
| 2014-09-11 | 79 | 10.5 |
| 2014-09-11 | 8 | 10.2 |
Water Potential - mode: raw
| Time | Species | Tree | readings (bar) | ||
|---|---|---|---|---|---|
| 2014-09-11 12:22:00 | OAK | 102 | -32 | -32.5 | -29 |
| 2014-09-11 12:22:00 | OAK | 35 | -25 | -27 | -12 |
| 2014-09-11 12:22:00 | OAK | 92 | -24 | -24.5 | -29 |
| 2014-09-11 12:43:00 | PINE | OLD | -20 | -23 | -22 |
| 2014-09-11 12:43:00 | PINE | YNG | -7.5 | -2.5 | -8.5 |
No TZ Grass Biomass data found
No TZ OakLeaves Biomass data found
No TZ PineNeedles Biomass data found
1 photos found
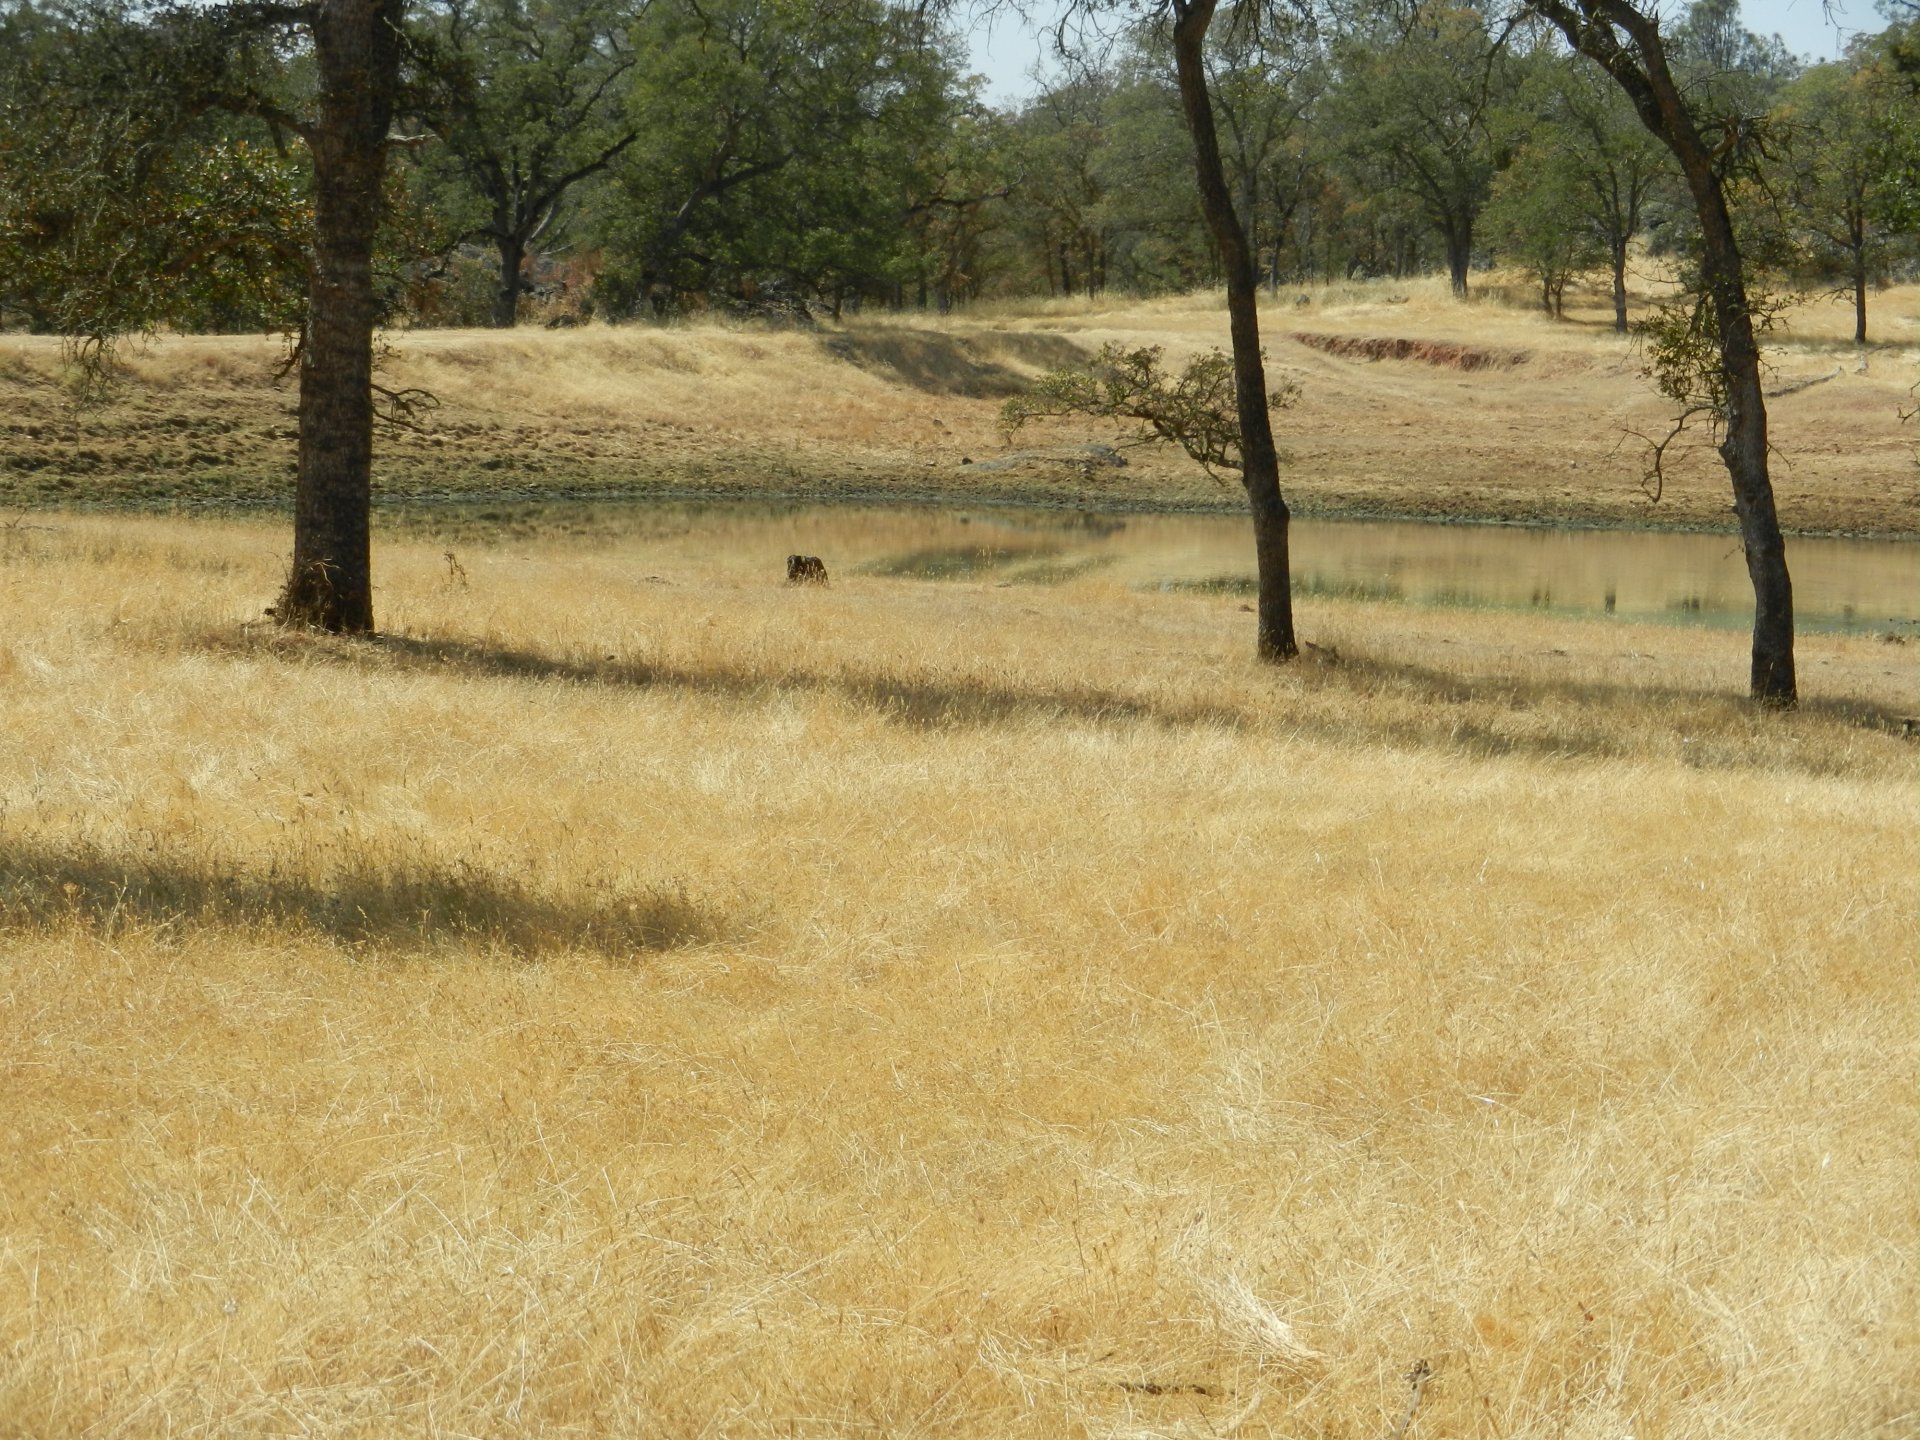
20140911TZ_Pond.jpg ( 2014-09-11 13:39:09 ) Full size: 1920x1440
Yellow grass near Tonzi pond
16 sets found
No data found for TZ_Fenergy.
11 TZ_tmet graphs found
11 TZ_soilco2 graphs found
Can't check TZ_mixed
3 TZ_mixed graphs found
1 TZ_fflux graphs found
8 TZ_fmet graphs found
1 TZ_tram graphs found
No data found for TZ_co2prof.
No data found for TZ_irt.
No data found for TZ_windprof.
1 TZ_tflux graphs found
2 TZ_sm graphs found
Can't check TZ_met
1 TZ_met graphs found
Can't check TZVR_mixed
8 TZ_osu graphs found
No data found for TZ_fd.
Tonzi Z-cam data